Import Menu
This menu is available for any subproject once you have created a new project or opened an existing one.
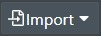
The import drop-down menu allows you to import various data, content, or online services to your project (sub-project) as shown in the following menu:
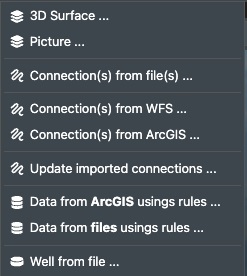
The content or services you add will then be added in the corresponding content or layer folders in the Project View as shown here:
Read on below for how to add the various content types and online services:
3D Surface
This allows you to add Bathymetry and/or Survey data to your Field layout in GeoTiff or X,Y,Z (pointcloud) format. You can add multiple Bathymetry/Surveys to a sub-project. FieldTwin Design will then height- or depth-sample if you will each Bathymetry layer individually, and where there is no Bathymetry data the default “Sea Level” value from the Project settings will be used.
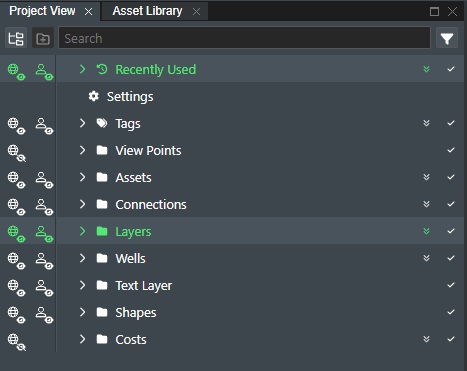
Selecting this option will display a dialog that will allow you to select a file and add it as a new 3D surface layer.
Limit import to - If you want to load 3D Surface data such as Bathymetry with much higher resolution for more accurate sampling, you can select between Current View Box or any defined View Point for the project, which will only then process the data for the current view port or View Point stage area.
ArcGIS - Select this option if you will import bathymetry data from a WMS map service. Read more here Create ArcGIS
File(s) - This will display a file dialog for selection of the 3D surface file you wish to upload.
Existing - If you have previous uploaded a 3D surface file and selected the Preserve Source File option, you can select it again here as the original source file is already stored securly in the tenant and you do not need to upload it again for further processing.
NODATA - When checking this option, the value specified will be use to remove points that have the exact same depth value.
Preserve Source File - Check this box if you want FieldTwin to securly store the orignal file after upload so it can be used later for further 3D surface processing such as the Generate alongside connections option. If you do not check this option the orignal 3D surface file is deleted immediately after processing.
Name - This field will allow you to change the name of the 3D surface file that will be converted to a more meaningful layer name. By default, this will be populated by the file name selected.
Quality - Allows you to select the conversion quality on the 3D surface file you wish to upload. You can choose between; Low, Normal, High, and Extreme. This defines the resolution of the 3D mesh created. The default selection is Normal, which usually is a good tradeoff between performance and resolution.
Since this is a browser-based solution and given the size and dimensions of the bathymetry files we resample the bathymetry data on conversion on the server side so it can be sampled real time in the browser. So based on the quality setting we map the bathymetry to a texture which is then also resized to best fit the aspect ratio of the bathymetry area.
The quality settings are resampled as follows:
| Quality | Resolution |
|---|---|
| Extreme | 512x512 pixels |
| High | 256x256 pixels |
| Normal | 128x128 pixels |
| Low | 64x64 pixels |
To exemplify for a 4 x 2 km bathymetry file with the "Normal" setting and with aspect ratio applied the conversion will use a 256 x 64 setting making 1 pixel equal 4000/256 m = 15,6 meters
For a 5 x 5 km bathymetry file with "High" setting the resolution will be 5000/256 = 19,5 m and for "Extreme" 5000/512= 9,7 m per pixel
Note! You can upload multiple bathymetry files with varying resolution in the same project so you can have e.g. a more detailed DEM for areas around a pipeline.
Survey Type - Select what type of survey or elevation model you will be importing using the drop down list. The following options are available:
-
Topographic - This option allows you to load land based elevation models e.g. DEMs (Digital Elevation Models) that have positive height or Z values.
-
Bathymetry - This will process the file as seabed survey data e.g. bathymetry data.
-
Reservoir - Select this if you are adding reservoir horizon scan data from Petrel or similar SW packages.
-
Colormap - Select this if the file has colormap data e.g. HCPT (Hydrocarbon Pore Thickness values) or similar that you afterwards can choose to height sample on top of another 3D surface.
Generate alongside connections - Select this option if you want to load bathymetry data along specific pipeline profile(s) for higher resolution seabed data.
-
Connections - Click in the connection box to display of available connection in the project and select the one(s) you want to generate high resolution bathymetry for.
-
Resolution - Enter the desired resolution for the bathymetry in meters. Note! The better the resolution the more data will be generated.
Then click on Create to have the file automatically converted and added to your project. Click Cancel to abort.
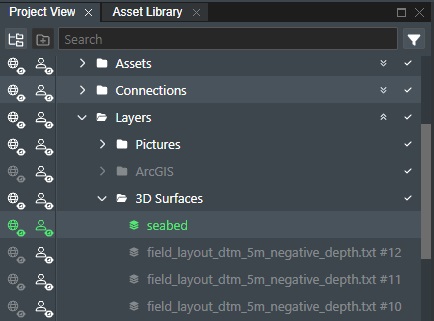
The file will then be uploaded and converted and displayed on screen when complete and the new 3D surface will be visible in the layer section of the Project View:
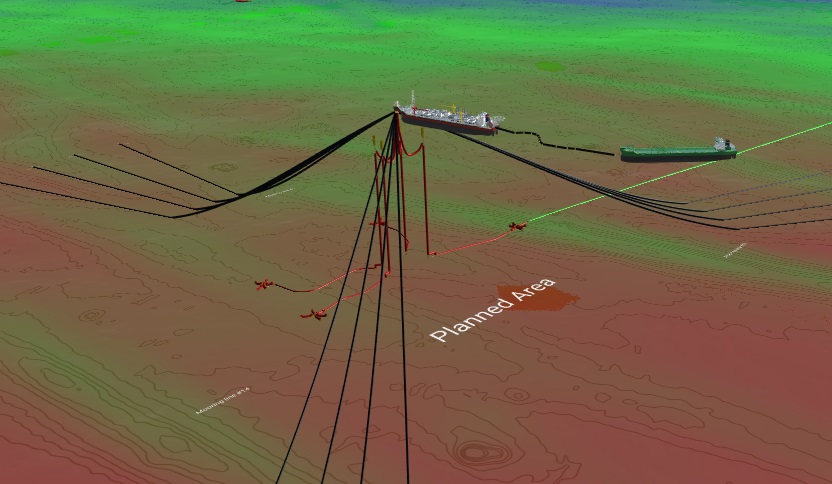
The loaded 3D Surface data e.g. bathymetry shown below in the stage area 3D View.
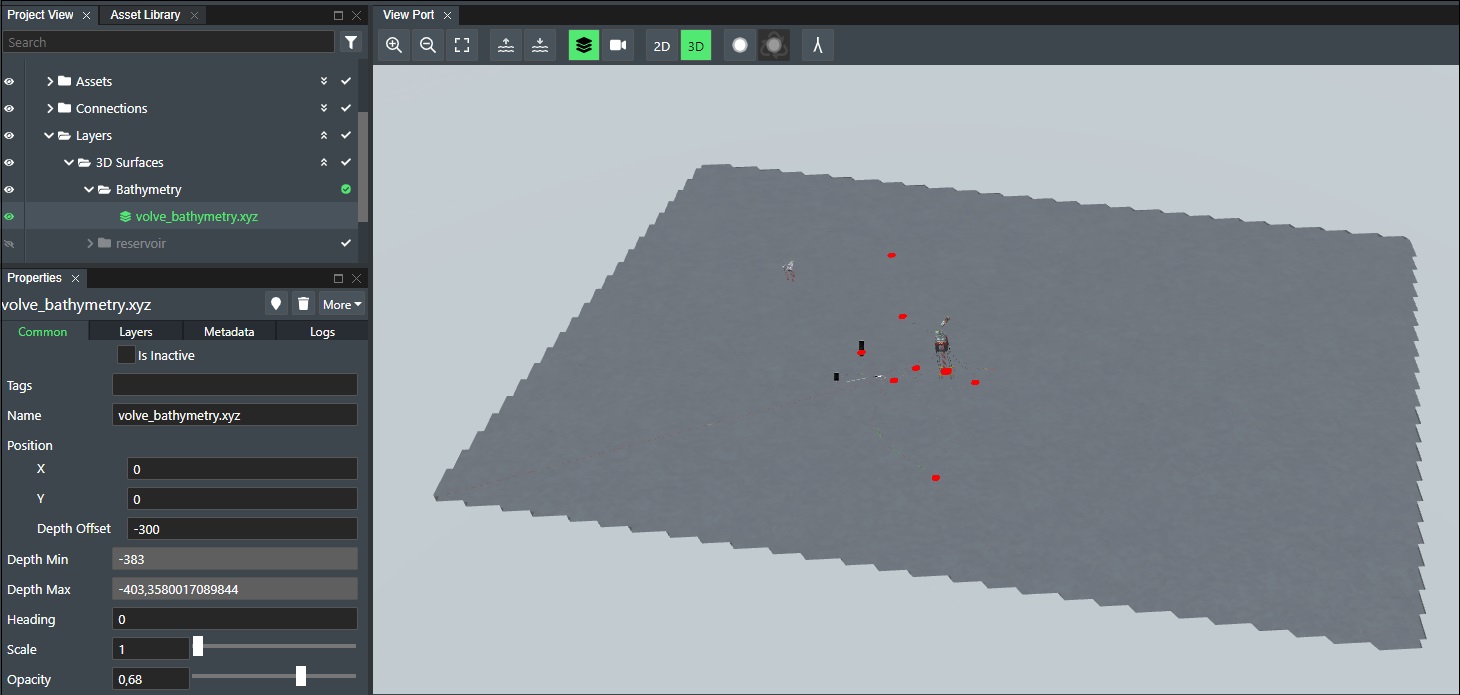
If you select the layer in project view it will be marked as selected and highlighted as shown here:
Selecting it will also position it in the viewport. Useful for finding the location at any time.
See the following section for more information on Layer Visibility
See the following section for more information on Layer Commands
3D Surface Attributes
You can adjust the attributes or settings if you will of the loaded 3D Surface layer in the bottom part of the Project View settings area for the layer as shown here
The Layer Attribute/Settings section has three (3) primary tabs namely Common, Layers, and Logs. If Metadata is defined on the surface layer a fourth tab with the label Metadata will also be displayed.
Common
The Common tab is comprised of the general common attributes/settings for a layer.
is Inactive - Check this box if the asset e.g. the surface is not used in the project. It will then be marked in red, and no longer be available for any sort of operation or function.
Tags - Any asset, connection, layer etc. can be tagged with a user defined name e.g. "Survey October". This makes it easy to create groups. Every item that share the same tag is automatically put in a folder under the tags node in the tree. Select existing tags from the list or start typing a tag name to add a new one.
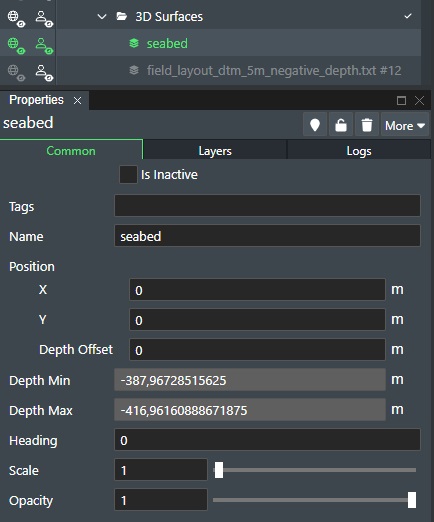
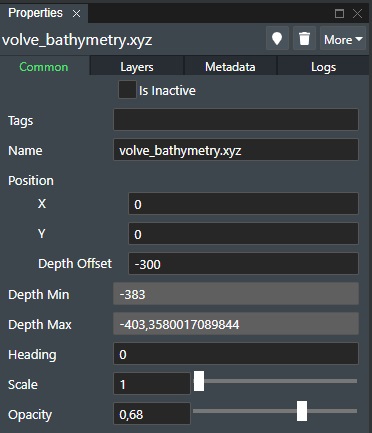
Name - The name of the uploaded 3D surface. You can change this by editing the name directly.
Position - This section allows you to edit the x, y, and Depth Offset values of the layer on the stage, which is inserted to a 0 origin position by default unless it has positioning data embedded e.g. GeoTIFF.
-
X - Edit this field to adjust the horizontal placement of the layer.
-
Y - Edit this field to adjust the vertical placement of the layer.
-
Depth Offset - Edit this field for adjusting the Z value of the surface layer. Negative values will move it downwards. Positive values will move it upwards.
Depth Min - This will display the minimum depth (bottom Z point value) recorded for the loaded surface layer.
Depth Max - This will display the maximum depth (top Z point value) recorded for the loaded surface layer.
Heading - Set the rotation in degrees (0-359) for the layer.
Scale (Surface) - Allows you to scale the 3D surface layer. Useful to better see elevation changes.
Opacity - Allows you to adjust the transparency of the layer by adjusting the value between 1 (Fully Visible) and 0(Invisible).
Layers
The layers tab is comprised of specific settings related to the 3D surface data format.
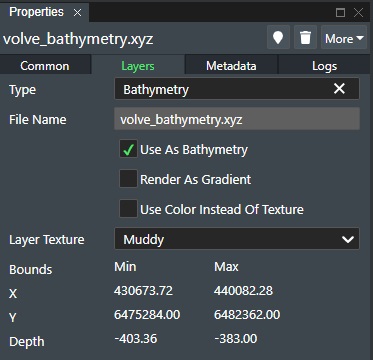
Type - If Metadata definitions have been defined in the account settings Layer Type Setting a list of the defined layer types will be shown here and allow you to select it. This will then add the corresponding Metadata tab for user selection.
Use as Bathymetry - Check this box if this 3D surface layer should be used as Seabed data that you will height sample assets/connections against.
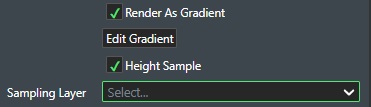
Render as Gradient - Select this option for e.g. simulating rendering of HCPT (Hydrocarbon Pore Column Thickness) data and represent these as contour plots based on assign the color gradient for the Z value. You can change the Z color sample values, by clicking on the Edit Gradient button. This will display the dialog for setting the Z depth color association for rendering as shown below.
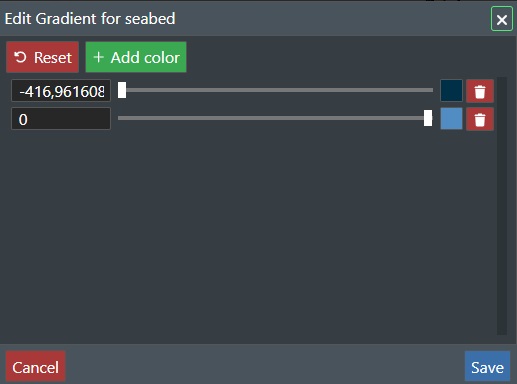
Use the sliders to adjust the color, or click on the Color display to the right of the slider. Click the +Add Color button to add another color scale. Press Save to save your settings. Cancel to abort, or Reset to restore to default values.
Also, when this option is enabled you will be presented with two (2) additional options:
-
Height Sample - Select this option to height sample (drape) the gradient on top of a surface layer e.g. a reservoir topscan.
-
Sampling Layer - Select the 3D surface layer that you want to apply the height sampling on from the list of the loaded 3D surfaces.
See the following sample for Render as gradient applied with HCPT values:
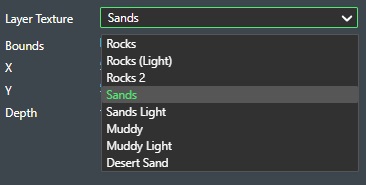
Layer Texture - You can change between different textures to be used in 3D view to better illustrate the seabed type e.g. sand or rocks. You set your selection using the drop-down list as shown here:
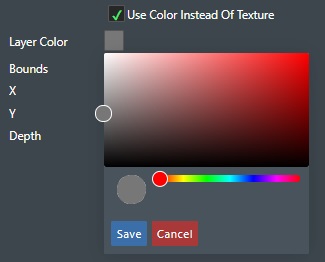
- Use Color Instead of Texture - Check this option if you want to use the seabed color instead. You set the seabed color setting below this option.
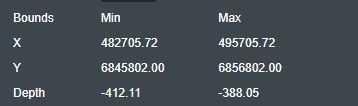
Bounds - This section will display the 3D surface boundary box information:
-
X - This displays the minimum and maximum X position values for the loaded 3D surface.
-
Y - This displays the minimum and maximum Y position values for the loaded 3D surface.
-
Depth - This displays the minimum and maximum Z position or Depth values for the loaded 3D surface.
Logs
The log section will show the last 10 operations for the selected layer
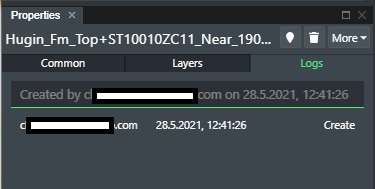
This displays the following columns with information:
User - The email of the user that made the change.
Date - The date and time of the change.
Keys - The operation that was performed.
Metadata
If a selection has been made from the Type list in the Layers tab then the Metadata that has been defined in the account settings Layer Type Setting will appear in an additional tab as shown here:
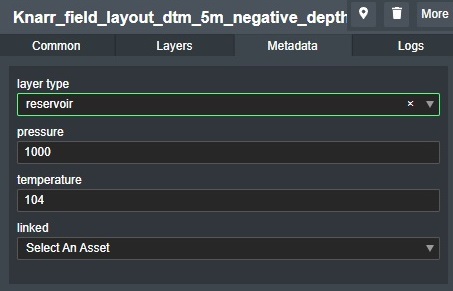
This will allow the user to make input and/or selections to the defined metadata attributes for the 3D surface, which then can be used for input for Flow Assurance or other integrations to the system.
Commands
See the following section for more information on Layer Visibility
See the following section for more information on Layer Commands
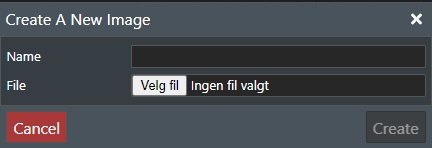
Picture
This will allow you to add images/pictures as new layers to your field layout. This will display a dialog that will allow you to select a file and add it as a new layer with a descriptive name of your choosing.
Supported picture formats are; JPEG, GIF, BMP, and Tiff.
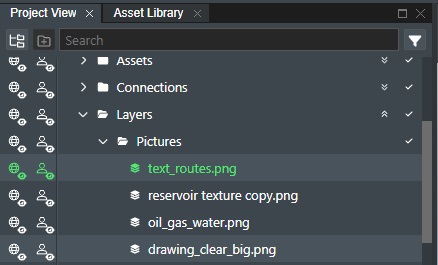
The upload picture will appear as a new Layer under Pictures in Project View as shown here:
Note! For easy picture positioning enable the Show Layer Movement Controls under Viewport Settings.
Picture Attributes
You can adjust the attributes or settings if you will of the loaded picture layer in the bottom part of the Project View settings area for the layer as shown here
The Layer Attribute/Settings section has three (3) tabs namely Common, Layers and Log.
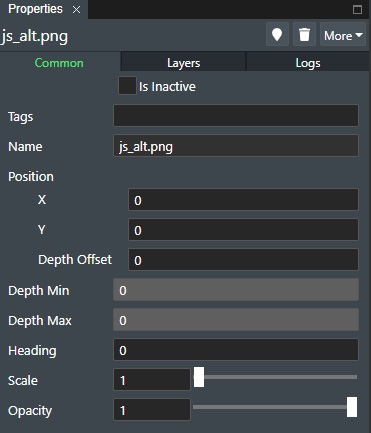
Common
The Common tab is comprised of the general common attributes/settings for a layer.
Is Inactive - Check this box if the asset e.g. the picture is not used in the project. It will then be marked in red, and no longer be available for any sort of operation or function.
Tags - Any asset, connection, layer etc. can be tagged with a user defined name e.g. "Survey October". This makes it easy to create groups. Every item that share the same tag is automatically put in a folder under the tags node in the tree. Select existing tags from the list or start typing a tag name to add a new one.
Name - The name of the uploaded picture. You can change this by editing the name directly. Use Edit button to the right for multi line text.
Position - This section allows you to edit the x, y, and Depth Offset values of the picture on the stage, which is inserted to a 0 origin position by default.
-
X - Edit this field to adjust the horizontal placement of the picture.
-
Y - Edit this field to adjust the vertical placement of the picture.
-
Depth Offset - Edit this field for adjusting the Z value of the picture. Negative values will move it downwards. Positive values will move it upwards.
-
Depth Min - This will display the minimum depth (bottom Z point value) recorded for the loaded image layer.
-
Depth Max - This will display the maximum depth (top Z point value) recorded for the loaded image layer.
-
Heading - Set the rotation in degrees (0-359) for the picture.
-
Scale (Picture) - Allows you to scale the picture layer. Useful to match the image to another content layer or an area on the stage.
-
Opacity - Allows you to adjust the transparency of the layer by adjusting the value between 1 (Fully Visible) and 0 (Invisible).
Layers
The layers tab is comprised of specific settings related to the Picture content category.
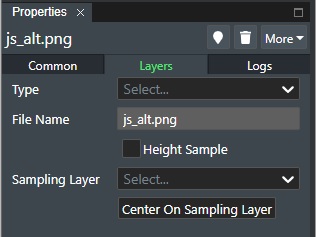
Type - If Metadata definitions have been defined in the account settings Layer Type Setting a list of the defined layer types will be shown here and allow you to select it. This will then add the corresponding Metadata tab for user selection.
File Name - Shows the name of the uploaded picture file.
Height Sampling - Enable this to allow the selected picture layer to be height sampled or draped if you will onto a 3D Surface Layer.
Sampling Layer - This allows you to select a 3D surface layer from a drop down list of loaded 3D surface layers to height sample the picture image onto e.g bathymetry data as an example.
- Center on sampling layer - This will center the image onto the selected sampling layer.
Logs
The log section will show the creation of the picture with a timestamp, and the last 10 operations for the selected picture:
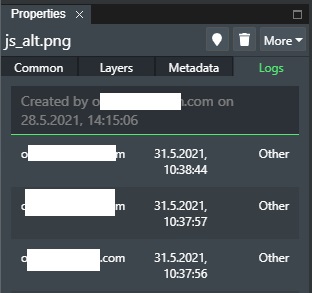
This displays the following columns with information:
User - The email of the user that made the change.
Date - The date and time of the change.
Keys - The operation that was performed.
Metadata
If a selection has been made from the Type list in the Layers tab then the Metadata that has been defined in the account settings Layer Type Setting will appear in an additional tab as shown here:
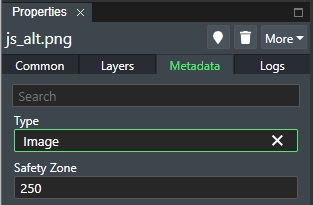
This will allow the user to make input and/or selections to the defined metadata attributes for the picture, which then can be used for input for integrations to the system.
Commands
See the following section for more information on Layer Visibility
See the following section for more information on Layer Commands
Connection(s) from File(s)
This option allows you to import connection profiles in x,y,z format from other engineering SW/tools into FieldTwin Design for more accurate display of connections. To create a new connection from file, select this option from the Import menu. In addition to text files in X,Y,Z format this function supports the import of GeoJSON and Shape (SHP) files.
Support for Text and X,Y,Z files
The XYZ file format should be plain text with no headers, using spaces or commas as a separator. Values should be specified in the project's coordinate reference system with Z values negative when below sea level. For example:
100  200  -450.5
105  205  -451.2
or
100, 200, -450.5
105, 205, -451.2
Support for GeoJSON files
Many WMS (mapping) servers like ArcGIS allows you to extract/export pipelines in GeoJSON format if you store your facility data there.
GeoJSON is an open standard format designed for representing simple
geographical features, along with their non-spatial attributes.
It is based on the JavaScript Object Notation (JSON).
Support for SHP files import
Most CAD software will allow you to save or export your pipelines as “SHP” files.
The shapefile format is a geospatial vector data format for geographic
information system (GIS) software. It is developed and regulated by Esri
as a mostly open specification for data interoperability among Esri and
other GIS software products. The shapefile format can spatially describe
vector features: points, lines, and polygons, representing, for example;
water wells, rivers, and lakes. Each item usually has attributes that
describe it, such as name or temperature.
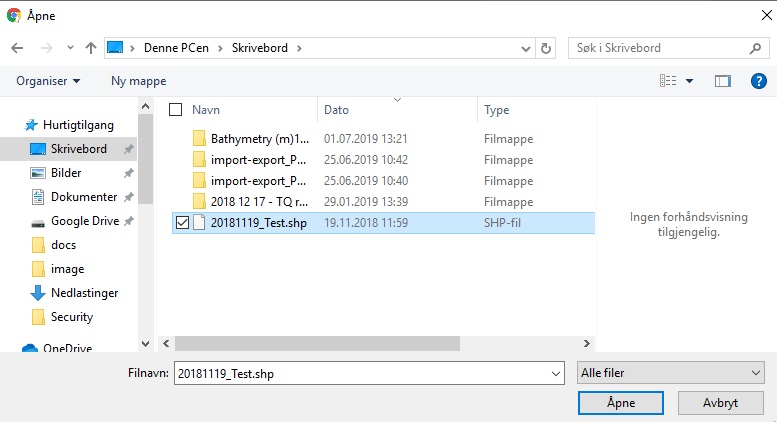
To import these type of data formats into FieldTwin Design, select the Import Connection(s) from File(s). This will present the following dialog:
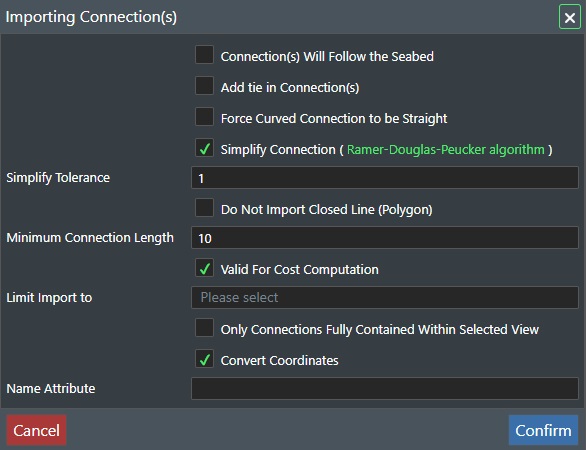
Then select from the following options:
-
Connection(s) will follow the seabed - If checked this will force the imported connection data Z values to follow the existing seabed/bathymetry or retain the original Z values in the file e.g. if you are importing a riser.
-
Add tie-in Connection(s) - Select this to add one additional point at both ends of the imported connection file. E.g. there is a long distance between the first and second point in the pipeline and you want to adjust the beginning of the pipe to tie in to a plem or similar, you have to add a new point to create the last bend. So selecting this option creates these "tie-in" points automatically.
-
Force curved connection to be straight - If this is checked the imported connection will be of type Straight.
-
Simplify Connection - When you import a connection it can be comprised of very high number of individual points that may be to much detail for what you need in FieldTwin Design. Use this option together with the Simplify Tolerance value to eliminate points along the connection. This function uses the Ramer-Douclas-Peucker algorithm for this purpose.
-
Simplify Tolerance - This value defines the tolerance unit value for elimination of individual points for the imported connection if Simplify Connection is checked. E.g. if the tolerance value is 1 for the unit e.g. meters then any extra individual points within 1 meter tolerance will be eliminated from the import.
-
Do not import Closed Line (Polygon) - If this option is checked then any imported connection(s) where the start and end point are the same will be discarded.
-
Minimum Connection Length - This allows you to define the minimum length for a connection to be imported. E.g. if this value is 1 m then only connections of 1 meter or longer will be imported.
-
Valid for Cost Computation - Check this option if you want the imported connection(s) to be included in the cost calculations. If you are importing e.g. data from a brown field then you usually would not want these included in your cost calculation.
-
Limit Import to - This drop-down list will allow you to select to only import data for a specific view. You can select between: None, Current View Box, or any created View Point(s).
-
Only Connections Fully Contained Within Selected View - This will only import connections that are within the selected View Box.
-
Convert Coordinates - This will convert the coordinates into your current projection system.
Name Attribute - This can be an attribute from the source file that can be used to name the connection to be loaded. Since the file is not loaded at this point a list of attributes is not available.
Press Cancel to exit the dialog.
Pressing Confirm will then display a file selection dialog:
And the file will be imported into FieldTwin Design and displayed as shown below:

Connection(s) from WFS
This feature supports direct import from WFS (read: Web Feature Service) mapping servers/services such as e.g. ArcGIS. You can directly import e.g. existing pipeline data as new connections in FieldTwin Design. To create a new connection from a WFS mapping service, select this option from the Import menu.
Import Profile From WFS
This will bring up the following dialog box with the following options:
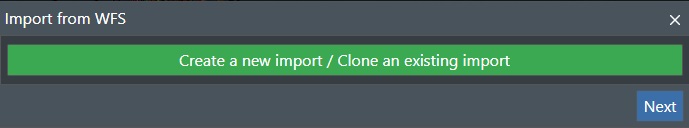
Create a new import / Clone an existing import - Select this option if you are importing a new set of WFS data or if you want to create a clone of an existing import made previously.
Press X if you just want to cancel the operation.
Create a new import / Clone an existing import
If you selected this option you will be presented with the following dialog:
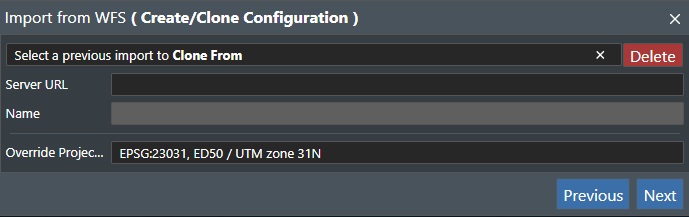
Select a previous import to Clone From - Select a previous import operation from the drop down list.
Server URL - Here you input the WFS server address that you will query for data. In this example we use Norwegian Petroleum Directorate WFS server:
https://factmaps.npd.no/arcgis/services/FactMaps_ogc/3_0_ED50_z32/MapServer/WFSServer?request=GetCapabilities&service=WFS
Name - You can give a name for the import Server URL given above.
Override Projection System - This drop down list will load all the supported projection systems from the WFS server and you need to select which projection you want for the import. For the NPD sample you can use "EPSG:23032 - ED50 / UTM zone 32N".
X - This will close the import dialog.
Previous - This will go back to the previous dialog box.
Next - Press this button to continue the WFS import process.
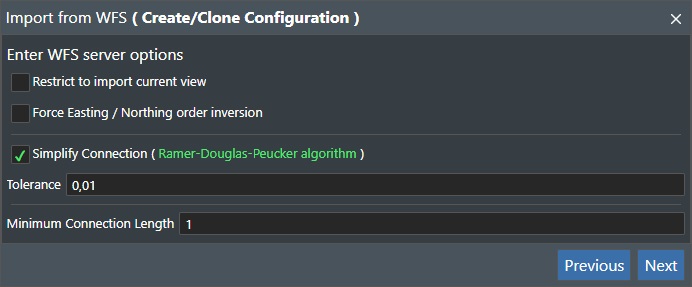
Restrict to import current view - If you check this option what you import will be restricted to the current stage view or viewport if you will.
Force Easting / Northing order inversion - If the WFS server is not compliant with the latest WFS standard you will need to check this box to read the data correctly.
Simplify Connection - Check this box to enable simplification of the imported connection(s) e.g. based on the Tolerance given below we will eliminate points for very detailed connections. This function uses the Ramer-Douclas-Peucker algorithm for this purpose.
Tolerance - Enter the tolerance value for performing the simplification algorithm if this option is checked above.
Minimum Connection Length - Enter the minimum length of the connection(s) to be imported. If connections are less than this value they will not be imported.
X - This will close the import dialog.
Previous - This will go back to the previous dialog box.
Next - Press this button to continue the WFS import process.
This brings up a dialog that list all the available described data layers from WFS query (read: GetFeature) as shown below:
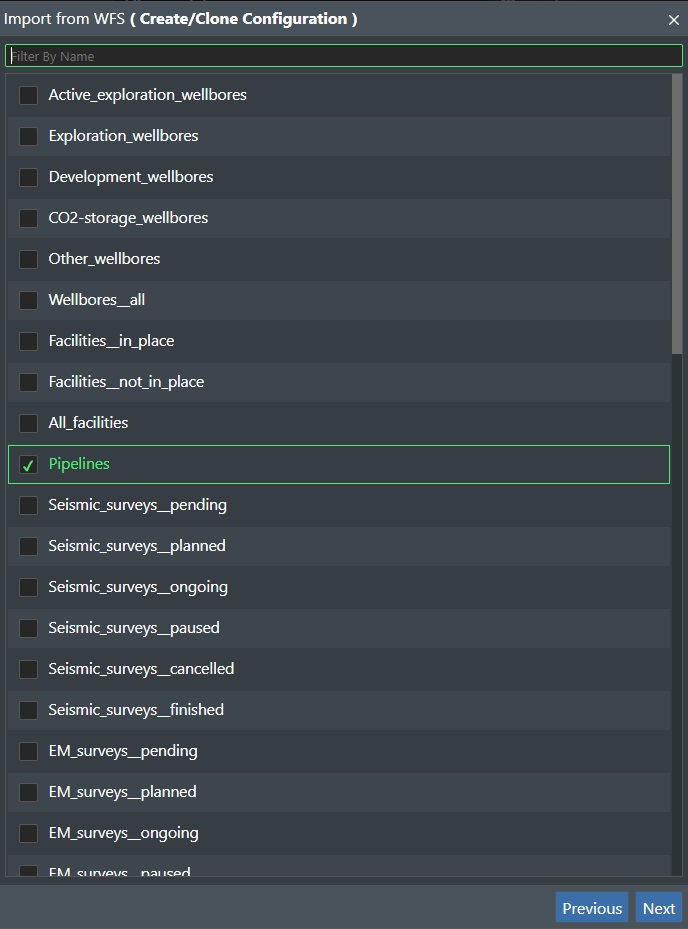
You can use the Filter By Name to narrow down the list by starting to type what your are looking for.
In this sample we selected “Pipelines”, and that will present a dialog listing all the available pipelines from this layer:
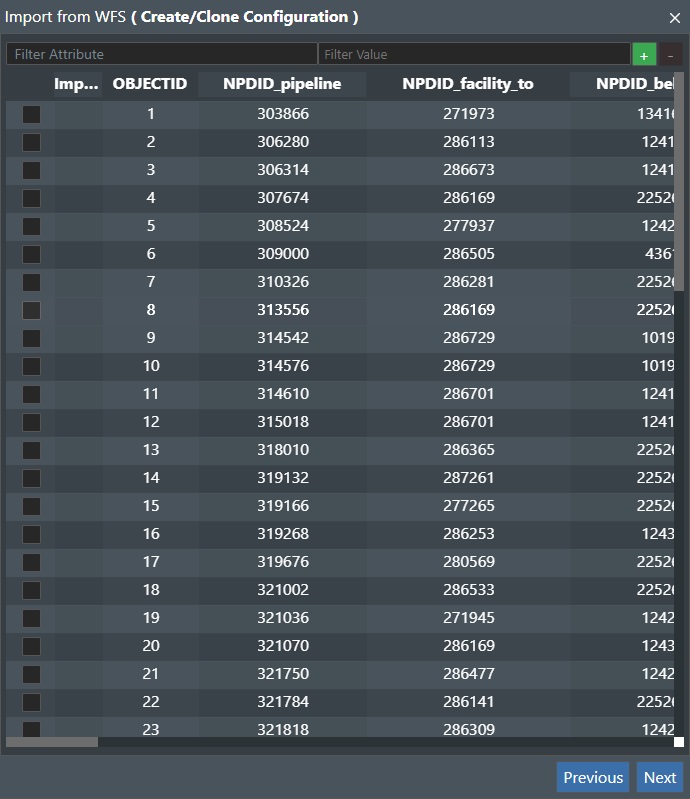
You also have filtering options for “Filter Attribute” and “Filter Value”. You can use the “+” and “-“ buttons shown to add or delete filters.
Then check the items you want to import from the list.
Then press the “Next” button to continue, X to abort, or Previous to go back to the previous dialog.
This will display the next dialog box:
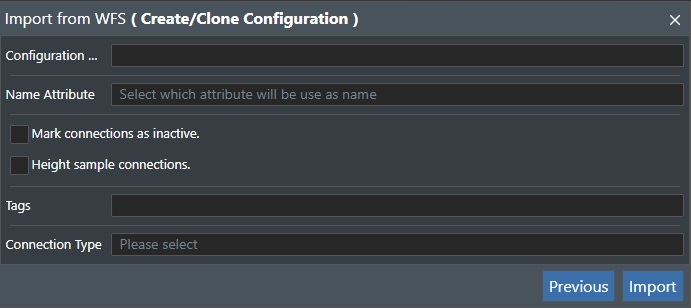
Configuration... - Enter the import configuration name designation here. This will then be stored so you can select it for re-import or cloning later.
Name Attribute - This is the name attribute to name the imported data e.g. pipeline here.
Mark connection as inactive - This will mark the connection as inactive when imported. You can change this by selecting the connection in Project View.
Height sample connections - Check this if the connection should follow the seabed / bathymetry.
Tags - You can apply tags on the import/clone operations.
Connection Type - You can select if the imported data should be classified as one of your existing connection types by selecting from the drop down list.
Then press the “Import” button to start the import from the WFS server. A message when the import process is complete will appear. PressX to abort, or Previous to go back one step.
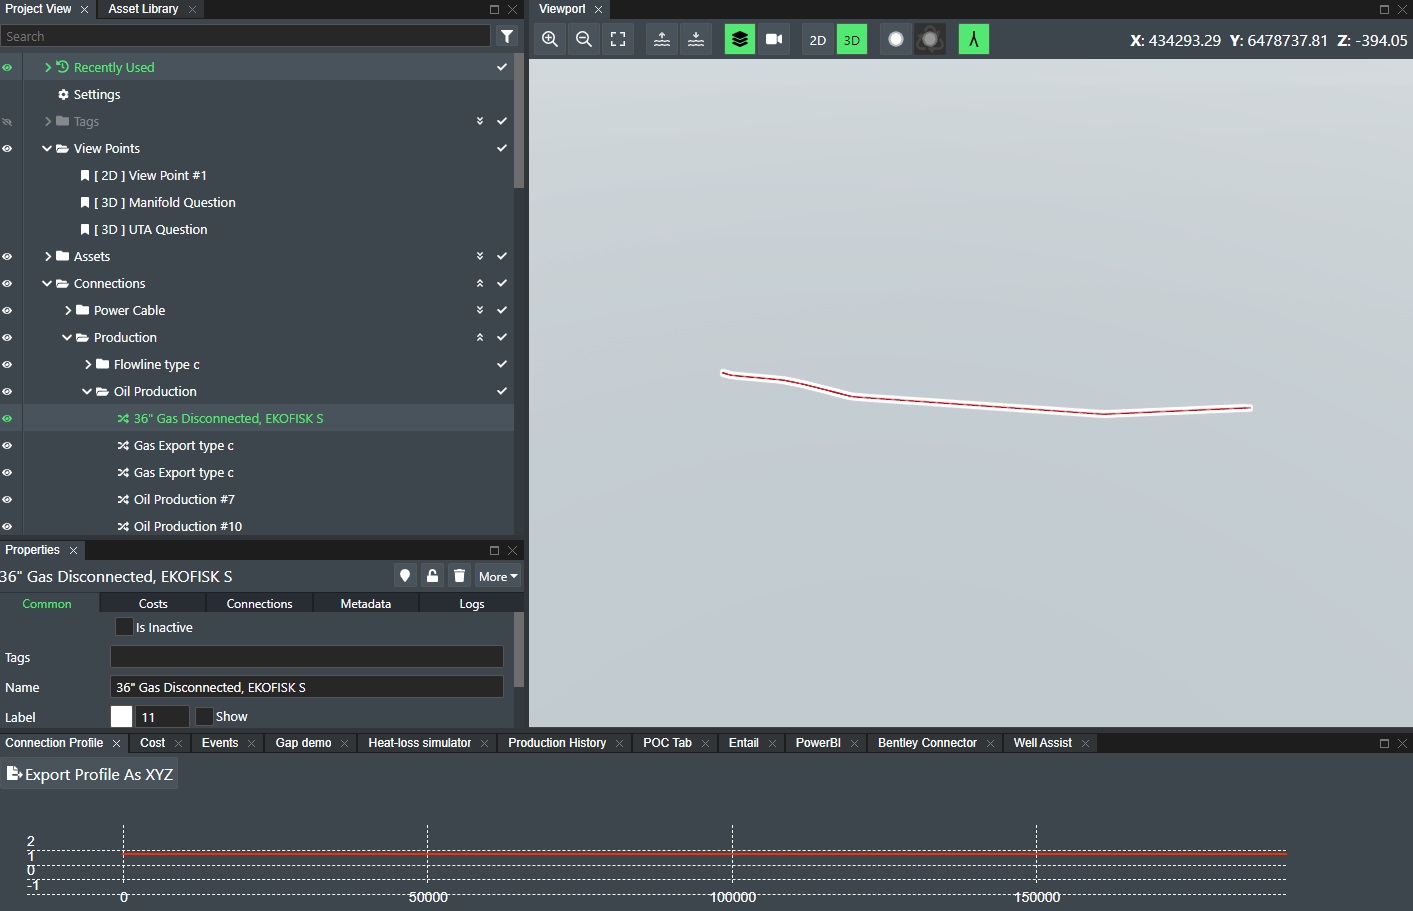
Note! The imported connection might not show up on the screen as that depends on the current field location. The easiest then is to find the imported entity in Project View under Connections in this example, and use the “Locate” function to be taken to the imported pipeline.
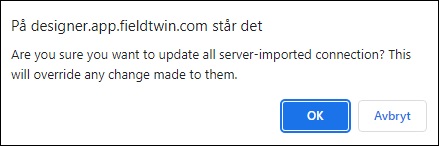
Update imported connections
If you select this option this means that you have already completed an import and/or clone operation and named the operation so it will be saved. This means that FieldAP has stored all the associated values and selections you did for the different import steps previously. This allow you to quickly step through the import dialog, but you can still make changes underway. Note! The dialog boxes are identical except for the dialog caption, which will read Import from WFS (Update Configuration)
Connection from ArcGIS
This feature is identical to Connection from WFS as described above, but supports direct import from ArcGIS server/services with REST API. You can thus directly import e.g. existing pipeline data as new connections in FieldTwin Design. To create a new connection from a ArcGIS REST API, select this option from the Import menu.
Update Imported Connections
Select this feature to run the previous connection import operation again. It will then display the following dialog box:
If no previous import connection operations have been run nothing will happen.
Data from ArcGIS/Files using rules
The Rules Engine allows you to create a set of rules and conditions when you import data from an ArcGIS map server or from files such as MS Excel. FieldTwin will then auto-create your field layout using your set of import rules. You can also import and export your rule set to use it for multiple projects.
See Rules Engine for documentation on these two import options.
Well from File
This command allows you to import well trajectories from either a text file or an Excel spreadsheet into your project where they will be displayed in 2D and in 3D if Reservoir mode is enabled. IYou can select multiple files to load several wells at once. To import a well just select the Well from File option from the Import menu.
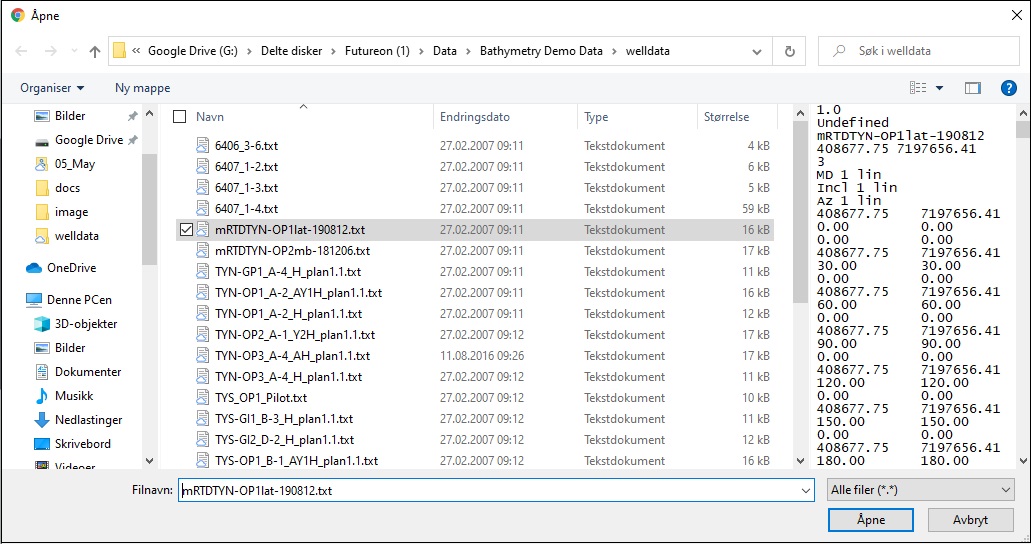
This will display a dialog for selecting the well data text or Excel files to load.
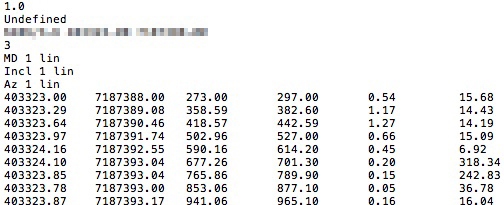
At the moment we support some of the most common well formats for well trajectory data e.g. Compass, DecisionSpace etc. A well data file will typically look like the following format as shown here:
If the well format is not recognized, an import helper dialog will be displayed:
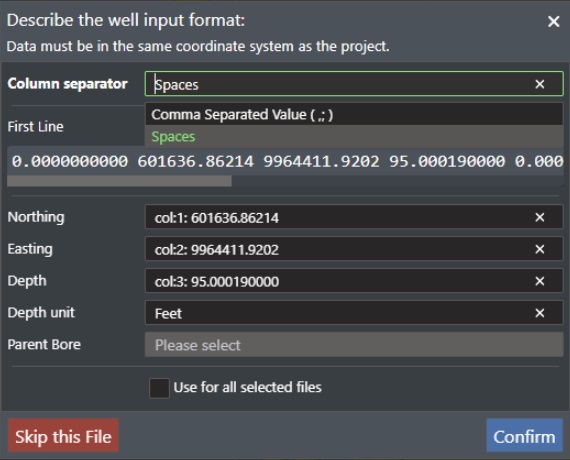
This will allow you to describe the well format file by using the following parameters:
-
Column seperator - Select the seperator used in the file you are importing. Options are Spaces or Comma Seperated Value.
-
First line - This number specifies which line number the x,y,z data should be read from e.g. this allows you to skip well data headers. Typically the first 3-7 lines of text.
-
Northing - This drop down list will display the first 3 columns of values read from the file as Col 0-2. Assign the appropriate column value as the Northing coordinate value.
-
Easting - This drop down list will display the first 3 columns of values read from the file as Col 0-2. Assign the appropriate column value as the Easting coordinate value.
-
Depth - This drop down list will display the first 3 columns of values read from the file as Col 0-2. Assign the appropriate column value as the Depth value.
-
Depth Unit - Select the depth unit used in the file. Options are Same as Project, Meter or Feet.
Parent Bore - If you are importing well bores and you have parent bores defined you can select the parent bore from this drop down list.
-
Use for all selected files - Check this option if you are importing multiple well files at once and they all have the same format.
-
Put all bores in the same well - If you have selected a parent bore then you can check this box to import all bores to the same well.
Skip this File - If you have selected multiple files and want to skip this file then press this button.
Confirm - Press this button to start the import, or press "x" on the dialog to abort.
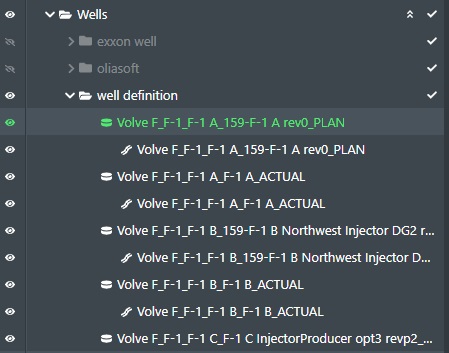
The loaded Well trajectories will the show up as new entries in the Wells Layer as shown here:
See the Well Attributes section above for more information.