Create Menu
This menu is available for any subproject once you have created a new project or opened an existing one.
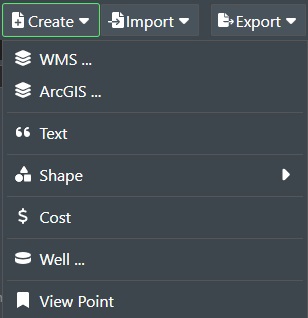
The create drop-down menu allows you to add various data, content, or online services to your project (sub-project) as shown in the following menu:
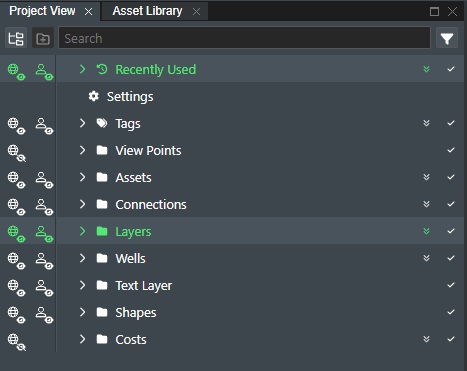
The content or services you add will then be added in the corresponding content or layer folders in the Project View as shown here:
Read on below for how to add the various content types and online services:
WMS
The use of geography data is becoming more and more important for oil and gas operators and service providers to make informed decisions. This can be in terms of locating and extracting new resources, better field design and planning, information retrieval and offers deeper insight into relationships and patterns as part of everyday operations. You can add a map layer to Field Activity Planner using the WMS (Web Mapping Service) Module.
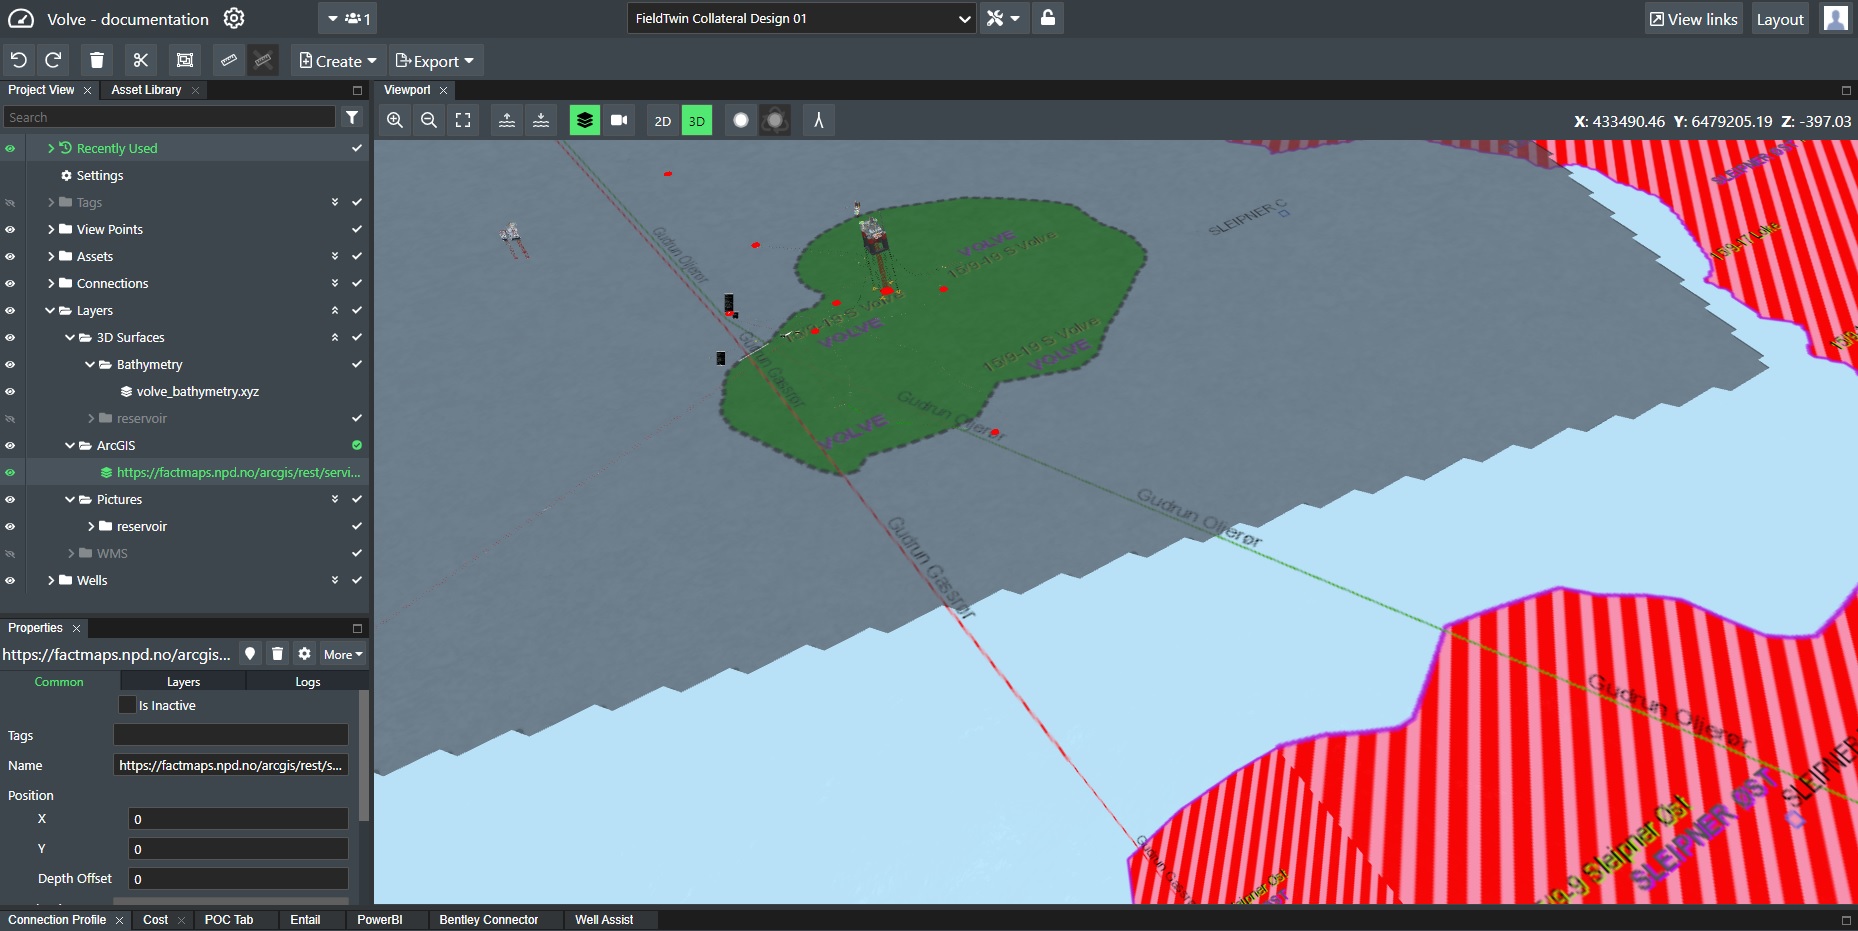
As an example, if you are working on project on the Norwegian continental shelf you can now access the Norwegian Petroleum Directorate open map service and visualise information such as wellbores, surveys, fields and discoveries, production licenses, agreement-based areas, permanent facilities and more as part of your layout to facilitate more effective discussions for e.g. equipment and piping scenarios. You can also directly connect your on-premise GIS software e.g. ArcGIS servers or similar.
Prerequisites
WMS services that uses LATitude and LONGitude as the coordinate system is NOT supported at present in this version. Support for this will be coming in a later release. ArcGIS REST services with re-projection is supported.
Also, if you have tried to add a map source (ArcGis Mapserver/WMS/WFS) to FieldTwin Design and are not seeing the map rendered correctly this could indicate that the project Coordinate Reference System (CRS) inputted in project settings are incorrect. In previous versions of FT Design, the maps would still show. As we aim to make the map display as accurate as possible from a geospatial perspective, we now prevent the map from being rendered in the Viewport outside the boundaries of the CRS. This to prevent incorrect geospatially based measurements or assets placements to be made.
The reason behind this is because every map projection causes distortion of shapes, areas, directions, and/or distances. Some projections such as “Robinson” or “Winkel Tripel” attempt to minimise distortion across the world through some compromise of all those factors. Other projections (such as UTM and State Plane) are designed for focused areas of the globe to keep the distortion minimal.
When specifying your Coordinate Reference System (CRS) in the project settings in FT Design you also set the bounding box to where the map data will be visible.
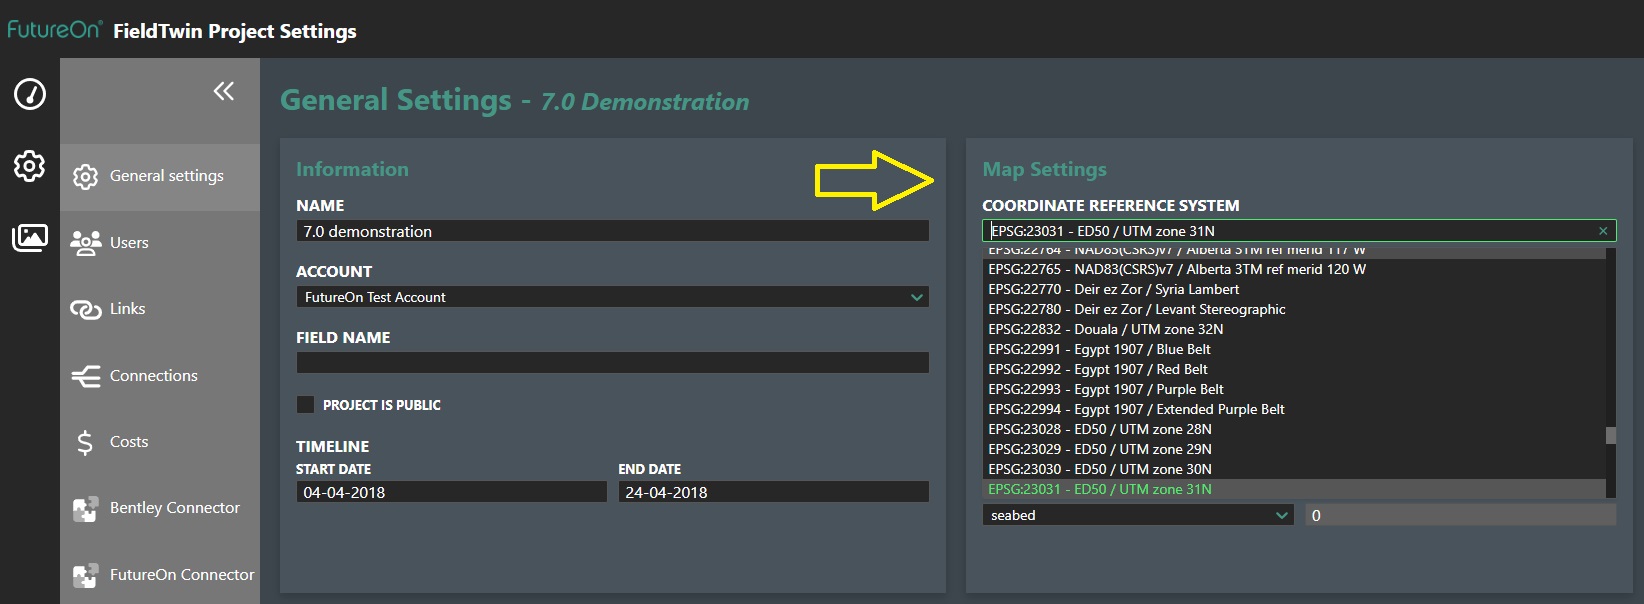
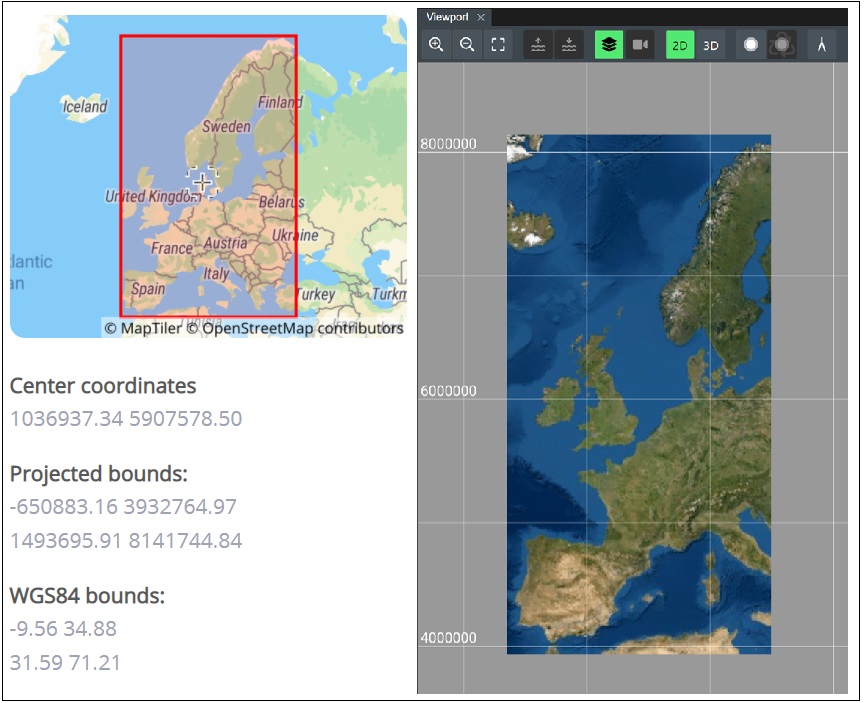
You need to make sure that the mapping data you link in is in fact compatible with this area (data coverage) or else you might experience that maps “cut off” in the middle of the project or simply that no data is showing at all from your map service into your project. See example below of the CRS 23031 and the boundary it delivers, if your project was outside this boundary the map would not show:
Example using ArcGis Mapserver and EPSG 23031 ED50 / UTM zone 31N
To determine if you have the right CRS for your project, we recommend that you consult with your in-house GIS specialists, especially if you have internal map services stored in ArcGIS or other WMS (Web Map Service) services. If you do not have access to internal GIS resources, or just use public data sources you may find the ESPG.IO service useful.
ESPG.IO simplifies discovery of coordinate reference systems utilised all over the world for creating maps and geodata and for identifying geo-position. It is a practical tool for anybody interested in cartography and digital map making, who needs to know exact latitude and longitude values for numerical coordinates in different spatial reference systems. Included map application allows to show the precise location anywhere on the planet also visually.
Adding a WMS Source
To add a map layer to FieldTwin Design simply select WMS from the Create menu. Note! You can configure as many WMS layers as you want using the same or different WMS servers.
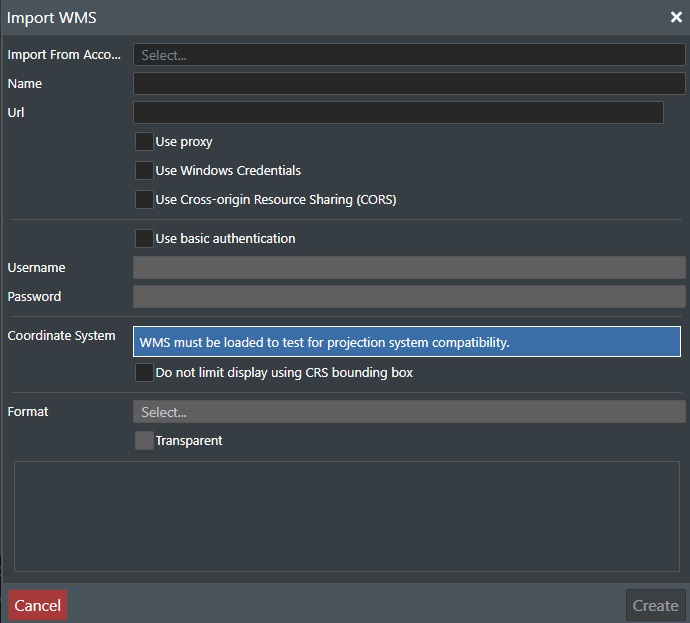
WMS Configuration
The dialog above allows you to add a new WMS service for you project.
Import for Account Settings - If you GIS department have preconfigured WMS services for you then simply select the one you want from this drop down list.
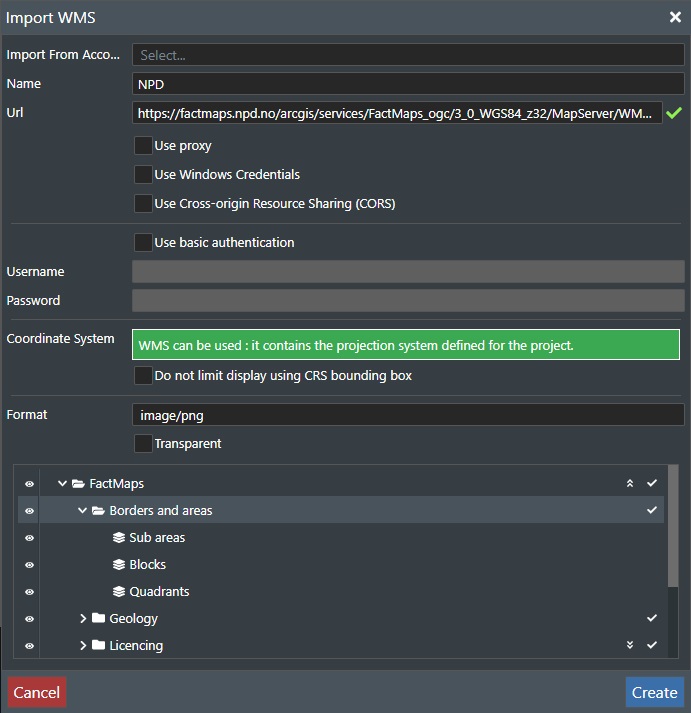
Name - Enter a descriptive name for the WMS service e.g. NPD if you use the sample above. If you leave it blank the URL will be used for the name.
URL - Enter the WMS service URL in this field.
As an example, this is the WMS URL for the NPD map service:
https://factmaps.npd.no/arcgis/services/FactMaps_ogc/3_0_WGS84_z32/MapServer/WMSServer
The application will then display the various configuration options returned by the WMS GetCapabilities and populate the available Projection Systems, Image Formats, and available Map Layers. These you can then configure as you see fit.
If no information is loaded and depending on your network settings, you may need to use some of the following options:
-
Use Proxy - If you want to access a non-HTTPS WMS you will have to check this option.
-
Use Windows Credentials - If your network configuration requires Windows Credentials select this option.
-
Use Cross origin Resource Sharing (CORS) - Bypass the security restriction that prevents requests being made from one origin to another.
-
Use basic authentication - If your authentication is over HTTP(S) etc. check this option and supply a user name and password.
-
Username - Enter your username here if you checked the Use basic authentication option.
-
Password - Enter your password here if you checked the Use basic authentication option.
-
Coordinate System - See Project Settings to ensure you have the correct CRS defined.
-
Do not limit display using CRS bounding box - Check this option if you want to disable the display boundaries defined by the specified Coordinate Reference System from the project settings.
-
Format - Allows you to select from a list of the image formats that are returned from the WMS server.
-
Transparent - Check this option if the image data should be returned with transparency for the WMS Layer. Note! Only if supported by the WMS Server. Also, if you have multiple transparent map sources make sure their depth offset is slightly different to render them both with transparency.
If the various settings are entered correctly then above the list at the bottom of the dialog will display a tree-structure of all the Layers available in the WMS service. Select the layers you are interested in by toggling the eye icon on or off.
Press Create to add the new WMS Layer, Save if you are just updating the dialog settings, or press Cancel to abort.
WMS Attributes
The Layer Attribute/Settings section has two tabs namely Common and Layers.
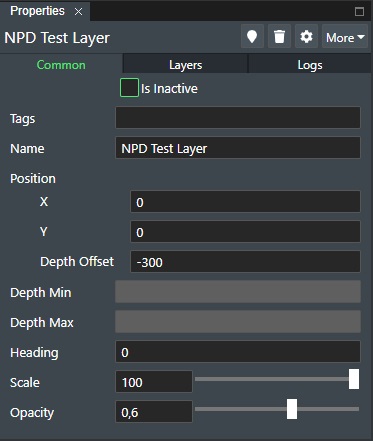
Common
The Common tab is comprised of the general common attributes/settings for a layer, but only the settings described below have an effect on WMS rendering.
Tags - This allows you to assign user defined tags for group operations to the WMS object.
Name - The name of the WMS Service. You can change this by editing the name directly.
Depth Offset - This allows you to set the Z value, which is useful in 3D mode and would allow the map to be e.g. rendered below sea level as an example.
Opacity - Allows you to adjust the transparency of the WMS layer by adjusting the value between 1 (Fully Visible) and 0 (Invisible). Note! If you have multiple transparent map sources make sure their depth offset values are slightly different to render them both with transparency.
Layers
The layers tab is comprised of specific settings related to the WMS Layer.
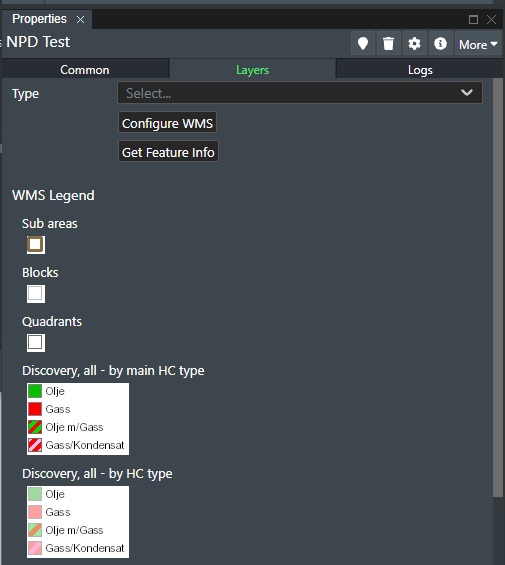
Type - If Metadata definitions have been defined in the account settings Layer Type Setting a list of the defined layer types will be shown here and allow you to select it. This will then add the corresponding Metadata tab for user selection.
Configure WMS - Brings up the WMS Configuration dialog. See above.
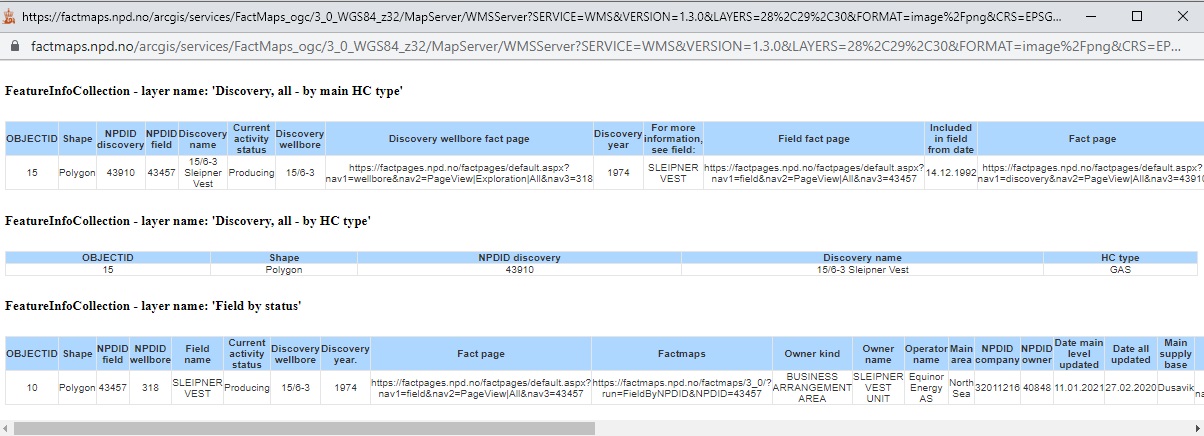
Get Feature Info - Click in the Viewport where the map is shown, and the WMS server will return GetFeature Information if any in a separate dialog as shown here.
WMS Legend - Display the WMS service Legend information if any.
Logs
The log section will show the creation of the WMS service with a timestamp and the last 10 operations for the selected WMS service:
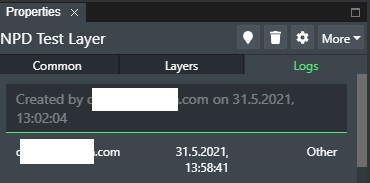
This displays the following columns with information:
User - The email of the user that made the change.
Date - The date and time of the change.
Keys - The operation that was performed.
Metadata
If a selection has been made from the Type list in the Layers tab then the Metadata that has been defined in the account settings Layer Type Setting will appear in an additional tab as shown here:
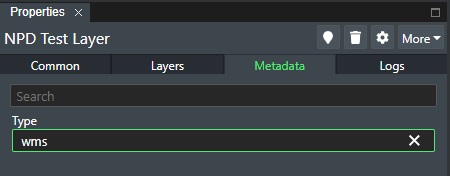
This will allow the user to make input and/or selections to the defined metadata attributes for the picture, which then can be used for input for integrations to the system.
Commands
See the following section for more information on Layer Visibility
See the following section for more information on Layer Commands
ArcGIS
This allows you to connect to ArcGIS WMS REST API to retrieve mapping data, and with ArcGIS REST services re-projection is supported.
To add a map layer from the ArcGIS REST API to FieldTwin Design simply select ArcGIS from the Create menu. Note! You can configure as many layers as you want using the same or different ArcGIS REST APIs.
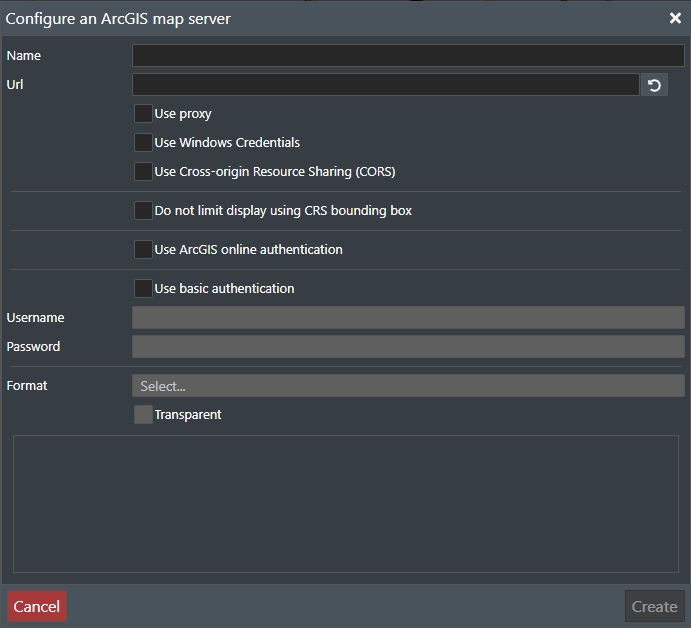
ArcGIS Configuration
The dialog above allows you to add a new ArcGIS service for you project.
Name - The name of the ArcGIS Service. You can change this by editing the name directly.
URL - Enter the ArcGIS REST API URL in this field.
As an example, this is the ArcGIS REST API URL for the NPD map service:
https://factmaps.npd.no/arcgis/rest/services/FactMaps/3_0/MapServer
The application will then display the various configuration options returned by the WMS GetCapabilities and populate the available Projection Systems, Image Formats, and available Map Layers. These you can then configure as you see fit.
Name - Enter a descriptive name for the WMS service e.g. NPD if you use the sample above. If you leave it blank the URL will be used for the name.
If no information is loaded and depending on your network settings, you may need to use some of the following options:
-
Use Proxy - If you want to access a non-HTTPS WMS you will have to check this option.
-
Use Windows Credentials - If your network configuration requieres Windows Credentials select this option.
-
Use Cross origin Resource Sharing (CORS) - Bypass the security restriction that prevents requests being made from one origin to another.
-
Do not limit display using CRS bounding box - Check this option if you want to disable the display boundaries defined by the specified Coordinate Reference System from the project settings.
-
Use ArcGIS online authentication - Check this option and supply your ArcGIS online user name and password in the ArcGIS dialog box presented.
-
Use basic Authentication - If your authentication is over HTTP(S) etc. check this option and supply a user name and password in the fields below.
-
Username - Enter your username here if you checked the Use basic authentication option.
-
Password - Enter your password here if you checked the Use basic authentication option.
-
Format - Allows you to select from a list of the image formats that are returned from the WMS server.
-
Transparent - Check this option if the image data should be returned with transparency for the WMS Layer. Note! Only if supported by the ArcGIS Server. Note! If you have multiple transparent map sources make sure their depth offset values are slightly different to render them both with transparency.
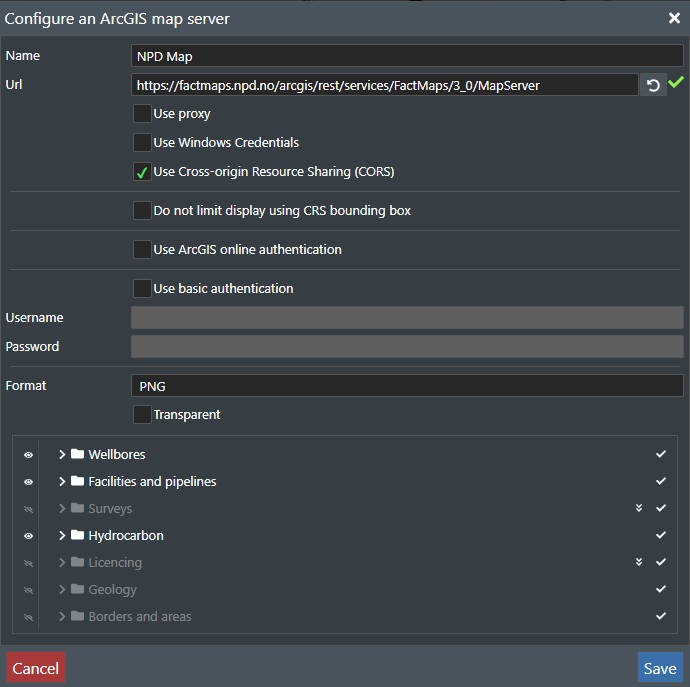
If the various settings are entered correctly then above the list at the bottom of the dialog will display a tree-structure of all the Layers available in the WMS service. Select the layers you are interested in by toggling the eye icon on or off.
Press Create to add the new WMS Layer, Save if you are just updating the dialog settings, or press Cancel to abort.
ArcGIS Attributes
The Layer Attribute/Settings section has two tabs namely Common and Layers.
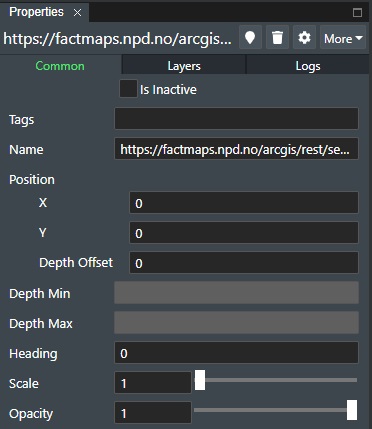
Common
The Common tab is comprised of the general common attributes/settings for a layer, but only the settings described below have an effect on WMS rendering.
Tags - This allows you to assign user defined tags for group operations to the WMS object.
Name - The name of the WMS Service. You can change this by editing the name directly.
Depth Offset - This allows you to set the Z value, which is useful in 3D mode and would allow the map to be e.g. rendered below sea level as an example.
Opacity - Allows you to adjust the transparency of the WMS layer by adjusting the value between 1 (Fully Visible) and 0 (Invisible). Note! If you have multiple transparent map sources make sure their depth offset values are slightly different to render them both with transparency.
Layers
The layers tab is comprised of specific settings related to the ArcGIS Layer.
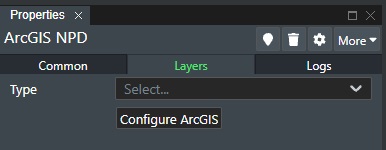
Type - If Metadata definitions have been defined in the account settings Layer Type Setting a list of the defined layer types will be shown here and allow you to select it. This will then add the corresponding Metadata tab for user selection.
Configure ArcGIS - Brings up the ArcGIS Configuration dialog. See above.
Logs
The log section will show the creation of the WMS service with a timestamp and the last 10 operations for the selected WMS service:
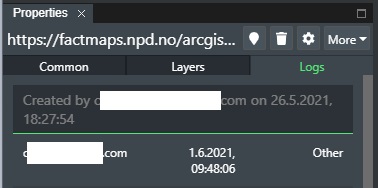
This displays the following columns with information:
User - The email of the user that made the change.
Date - The date and time of the change.
Keys - The operation that was performed.
Metadata
If a selection has been made from the Type list in the Layers tab then the Metadata that has been defined in the account settings Layer Type Setting will appear in an additional tab as shown here:
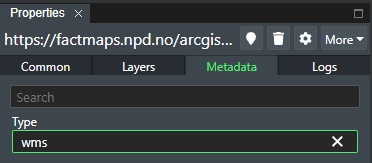
This will allow the user to make input and/or selections to the defined metadata attributes for the picture, which then can be used for input for integrations to the system.
Commands
See the following section for more information on Layer Visibility
See the following section for more information on Layer Commands
Text Layer
Use this function to freely annotate your field layouts at any position on the viewport. To add a text/comment etc. to the Text Layer simply select "Text" from the Create menu, and move the mouse pointer to the desired field location and CLICK the left mouse button to create the text entry. Note! You must click somewhere in the viewport e.g. field layout window for the text to be created. You can also select a "Text" box and use the regular copy/paste commands to create multiple entries.
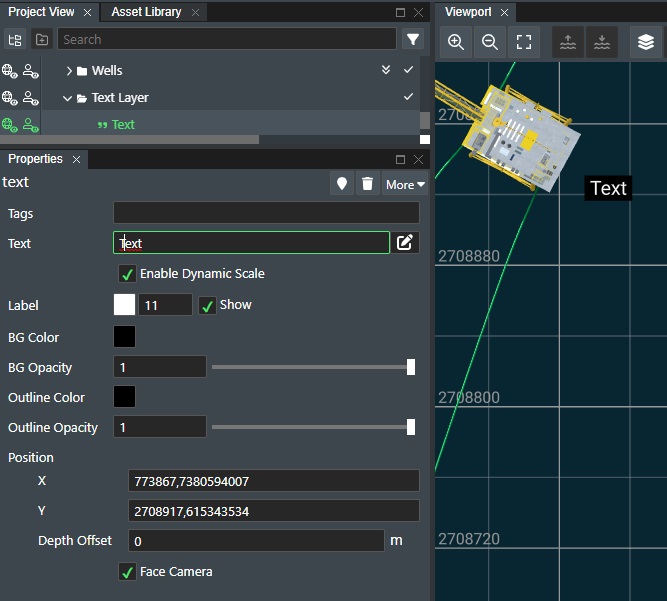
This will add the text "Text" on your layout at the position you clicked on the stage. This will create a new entry in the Text Layer section in Project View with the Common attributes as shown here:
Properties
The text properties tab is comprised of the general common attributes/settings for text rendering.
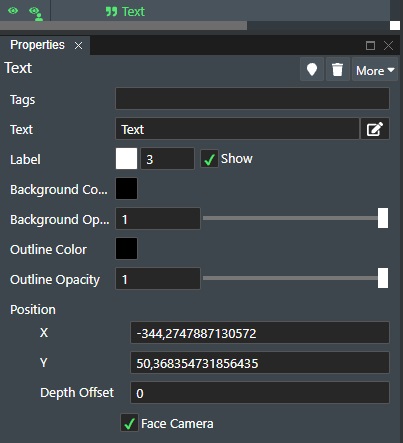
Tags - This allows you to assign user defined tags for group operations to the text object.
Text - Write you text here. If you wish to write a longer text simply click on the edit text icon to the right to display an "edit dialog" on screen where you can add multiple lines of text.
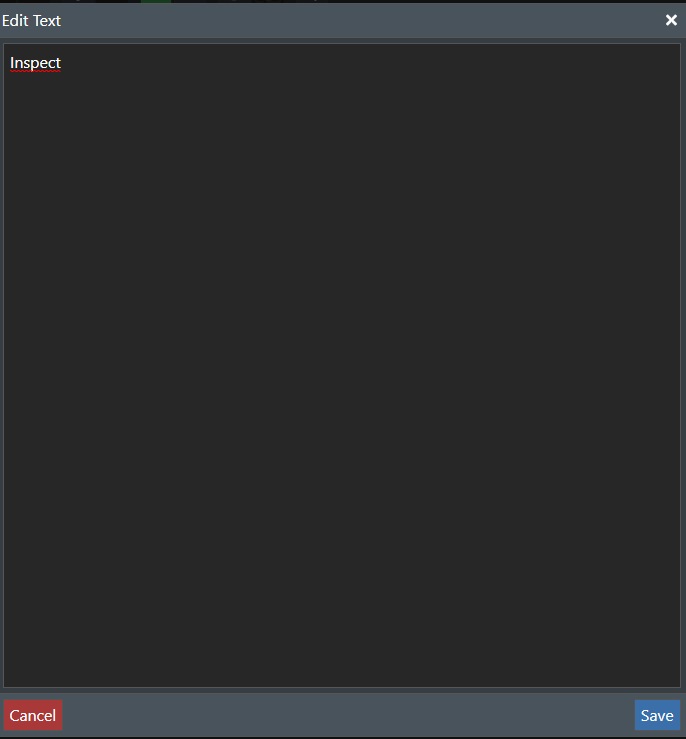
After adding your text entry, simply click "Save" to add your text, or click "Cancel" to exit!
Enable Dynamic Scale - Check this box to make your text layer scale dynamically with your field layout as you zoom in or out.
Label - Allows you to change the font color and size. Use the Show check box to select if the text should be On or Off.
BG Color - Click on the color picker to change the background color for the text box.
BG Opacity - Use the slider to control the background color opacity value between 0.01 and 1, where the latter is no opacity.
Outline Color - Click on the color picker to change the outline color for the text box.
Outline Opacity - Use the slider to control the outline color opacity value between 0.01 and 1, where the latter is no opacity.
Position - This section allows you to edit the x, y, and Depth Offset values of the text-box on the viewport.
-
X - Edit this field to adjust the horizontal placement of the text-box.
-
Y - Edit this field to adjust the vertical placement of the text-box.
-
Depth Offset - Edit this field for adjusting the Z value of the text-box. Negative values will move it downwards. Positive values will move it upwards.
-
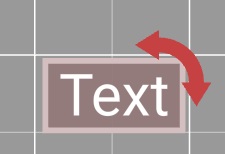
Face Camera - This is checked by default and shows the text always facing the camera. If you uncheck this box in either 2D or 3D mode it will allow the text box to be rotated by using the rotation helper gizmo as shown here:
Commands
See the following section for more information on Layer Visibility
See the following section for more information on Layer Commands
Shape
The new vector layer will be the layer that naturally includes our support for all kinds of vector elements and entities. The initial release enables you to create various shapes, but over time we expect to add other functionality such as markup, redline etc. We support the following vector shape primitives in 2D and 3D: Box, Sphere, Triangle, Circle, Rectangle, Cone, Cylinder, Ring, Torus, Connection Tube, and Connection FlatTube.
Once you select the Shape entry the following sub-menu will be shown.
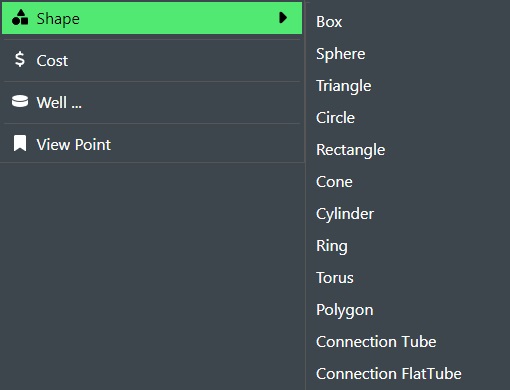
Select the shape you want to create in the Viewport from the menu, and the see the following section for documentation on each individual shape entity Create Shapes
Cost
You can quickly add add hoc or custom costs to your project by using the Create Cost command. Once you have selected this from the menu, the following Costs entry will appear in the Project View window if not present already:
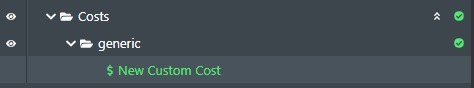
Select the New Custom Cost entry by clicking it to display the associated tabs in the Properties window.
Common
The Common tab is comprised of the general common attributes/settings for a custom cost.
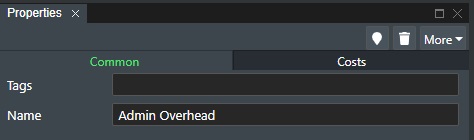
Tags - This allows you to assign user defined tags for group operations to the cost object.
Name - Write you text here to describe the cost item e.g. Admin Overhead.
Costs
The cost tab will display all the custom cost settings available to you for the selected entry.
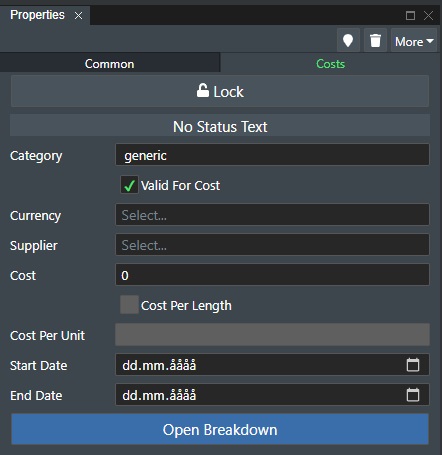
Lock - To lock a specific cost entry so it cannot be changed, simply click on the Padlock icon and it will toggle between Locked and Unlocked states.
No Status Text - This field will change if you are connected to a Cost Server, and will inform you of when the latest computation was done.
Category - This will display the available categories the custom cost can be assigned to.
Valid for cost - This box is checked as default. Uncheck it if this asset or connection should not be included in the calculation.
Currency - To set the currency to be used for that specific asset, simply select it from the drop down list.
Supplier - To define a supplier or vendor for the subsea asset, connection or vessel, you can select one from the drop-down list. You can also simply start typing in the name in this field and if the supplier is not already defined in the database you will see a line with the option to Add the new supplier appear below the edit field as shown here.
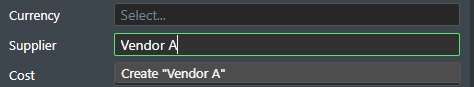
Simply select it and the supplier will now be defined for the project and is available for selection in the "Supplier field for all other assets in the current project.
Cost - To define or change the custom cost, simply assign a value in the cost field.
If you use real world scale in the stage settings and have defined the sea bed depth or loaded bathymetry data that defines the sea bed we automatically calculate the length of all connections. This also allows you now to assign a cost per unit that will automatically update in the cost module when a connection is edited.
Cost per Length - If you have defined a custom cost that you can supply a cost per length unit e.g. meter or feet. Check this box if you want to calculate cost per length.
Cost Per Unit - If you checked the option above, supply the unit cost number here e.g. cost per meter or feet.
Start Date - You can also specify a start date for the asset cost. This information will then be exported out to MS Excel if you use the Export function and can be useful when you work with CAPEX/OPEX calculations outside of FieldTwin Design.
End Date - You can also specify a start date for the asset cost. This information will then be exported out to MS Excel if you use the Export function and can be useful when you work with CAPEX/OPEX calculations outside of FieldTwin Design.
Open Breakdown - For all cost items e.g. assets, connections, and custom project costs etc. you can always add breakdown cost for an object in FieldTwin Design. E.g. break down asset cost into itemised parts and assigning individual cost for each sub part you add. You will find this option several places.
Open Breakdown - Press this button to display the dialog for assigning "Cost" for individual parts as shown below:
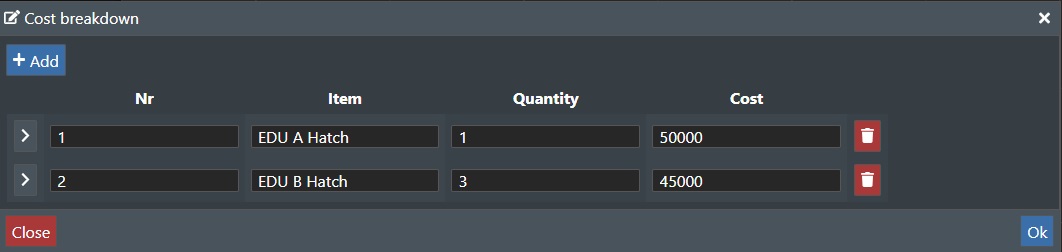
To assign cost for an individual part, simply click on the +Add button to add a new line for each part that you wish to assign the cost for. You can add information in each of the following separate fields; Nr, Item, Quantity, and Cost.
> - Press this button and the dialog will expand and show a Description and Notes field that you can add additional information into.
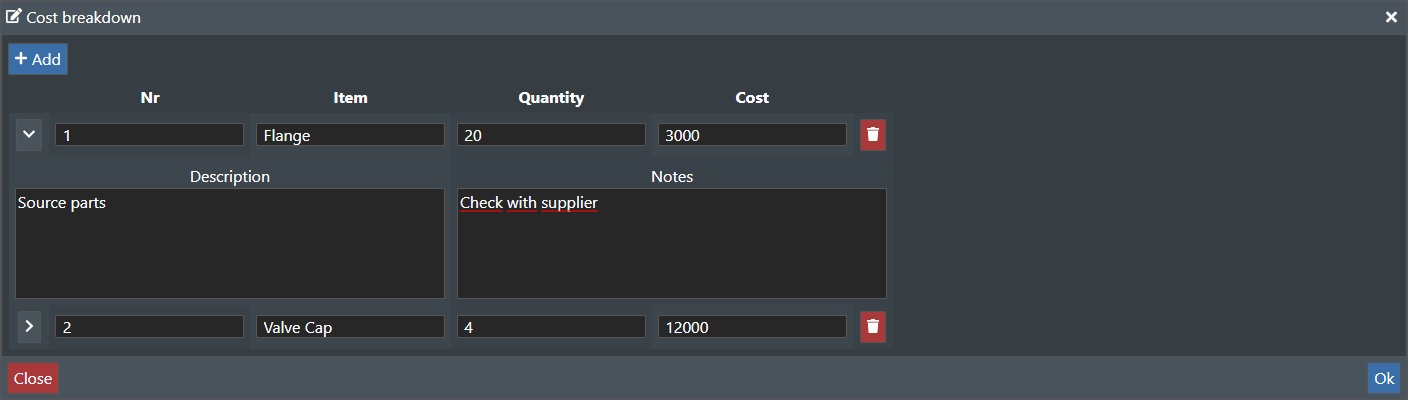
˅ - Press the down arrow to collapse the item entry again.
To delete an item from the list, simply click on the Trash icon to the right of the "Cost" field. When you are done, click on OK to accept the entries made. To exit, without saving any changes, click on the Close button.
Well
Well trajectories can be added to your project either manually, or by loading well trajectories from file, or programatically by using the REST API. See the illustration below for a project with well data:
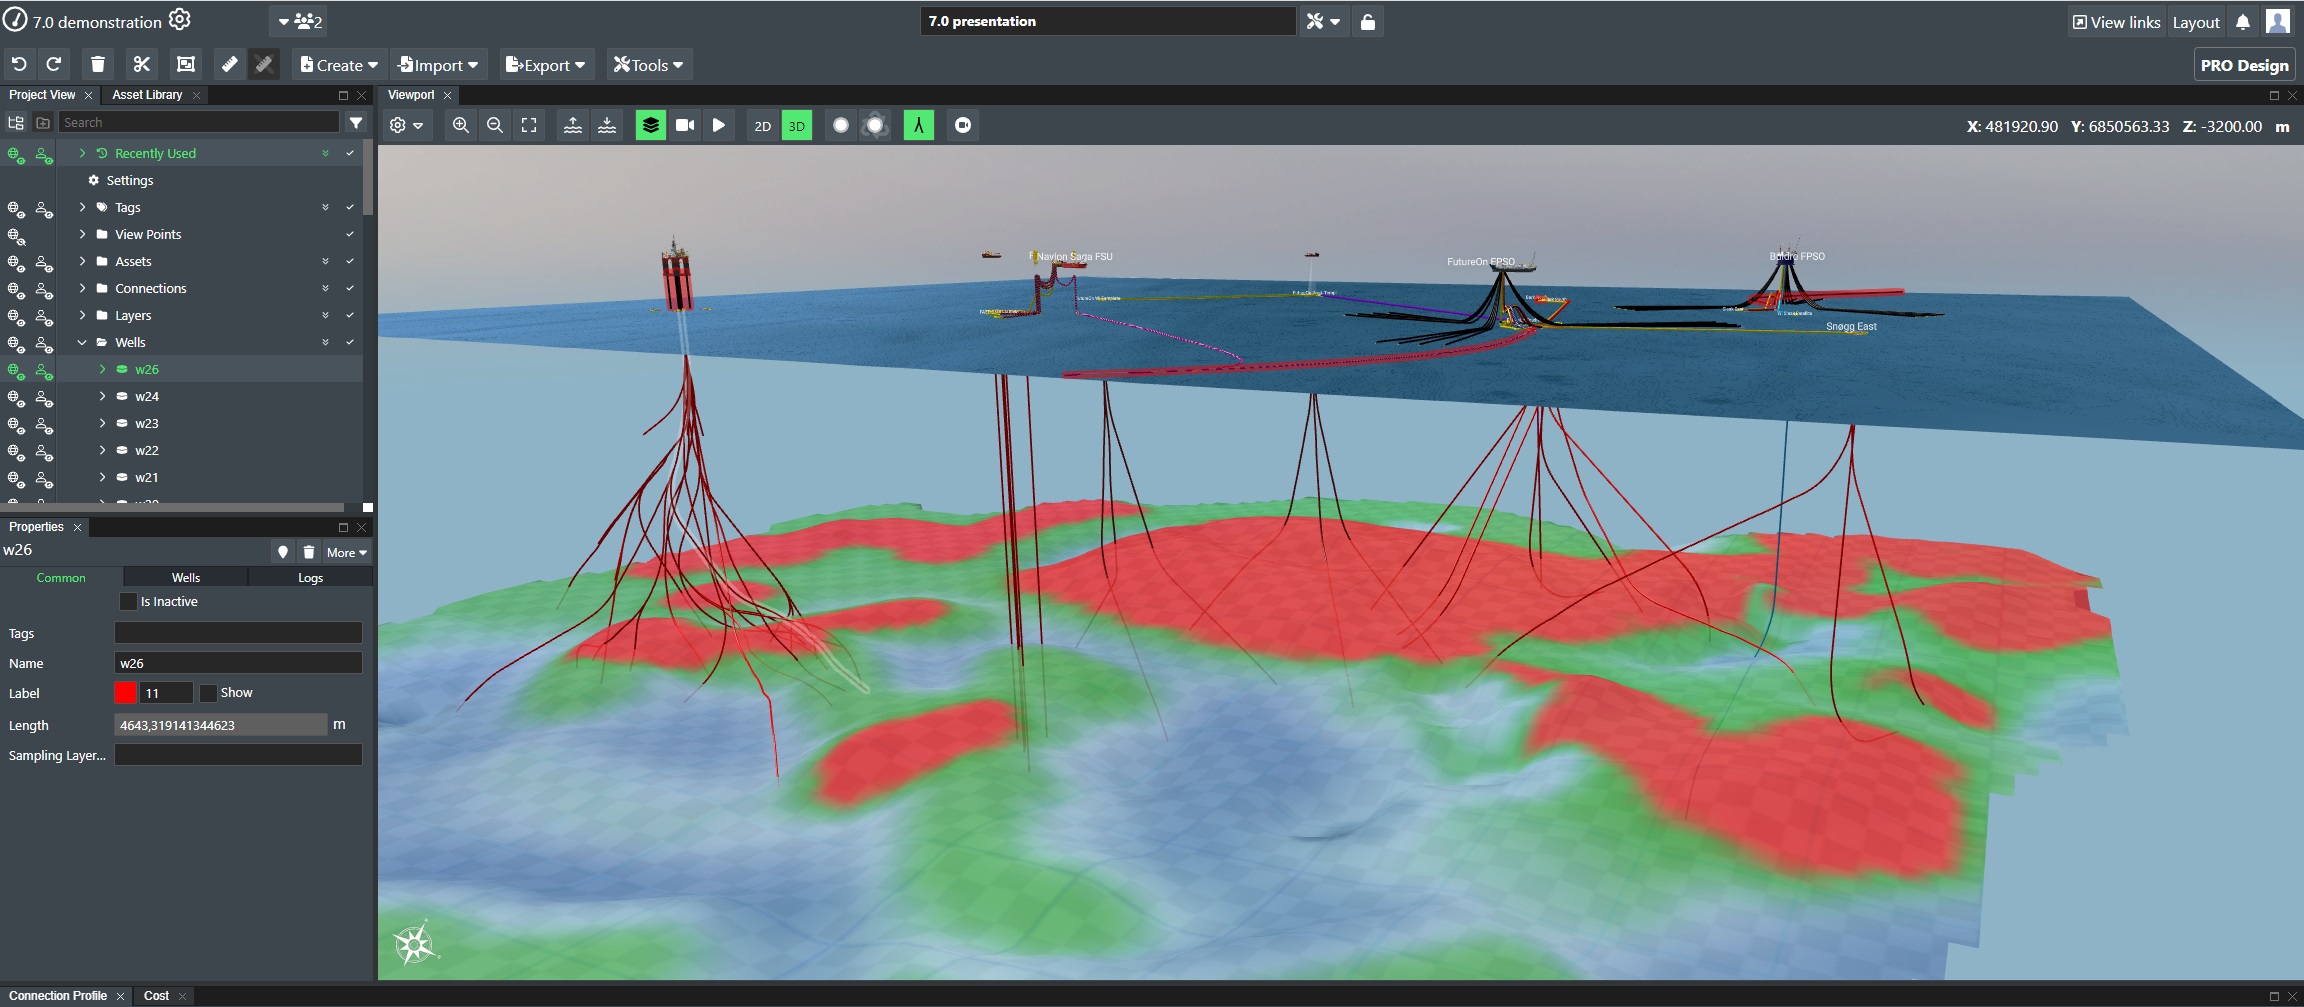
You can manually create well trajectories by providing a top hole location and adding optional additional well trajectory points. To get started select "Well" from the Create menu.
This will display the Well Editor dialog box as shown here:
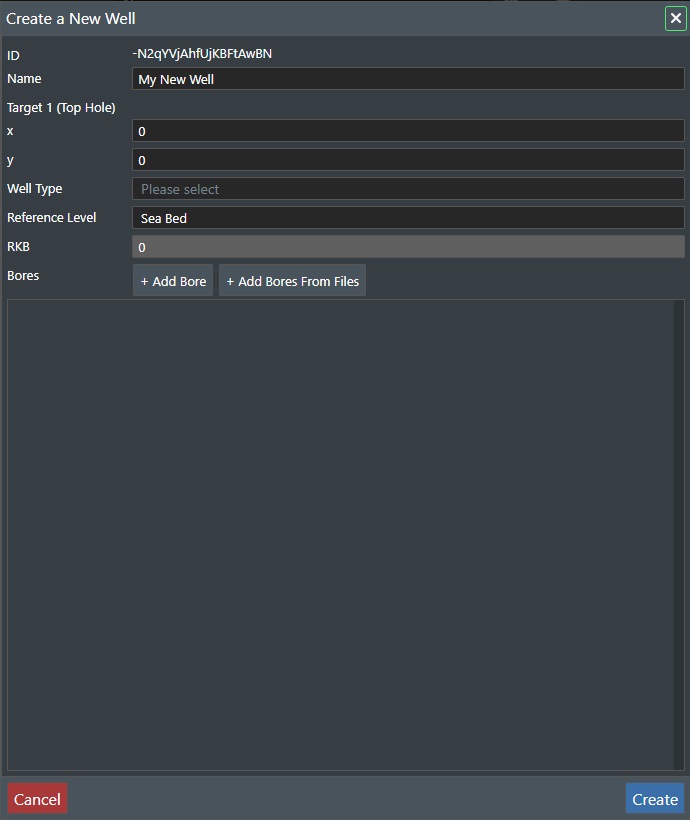
ID - This field will display the unique well ID. Note! This is a read only field, but can be used by the API.
Name - Specify the name of the new well you want to create, or edit an existing name.
Target 1 (Top Hole) - This section allows you to define the x,y coordinates for the top hole location.
-
X - Set the X coordinate value for the top hole location.
-
Y - Set the Y coordinate value for the top hole location.
Well Type - If metadata have been defined for Well Types in Account Settings > Well Types then they will appear for selection here.
Reference Level - Select the reference level for the drop down list with the following options; Sea Bed, Sea, or RKB.
RKB - If you selected the Reference Level to be RKB (Rotary Kelly Bushing), you enter the desired value here.
If you click the Create button now you will create a well with a top hole location only and no trajectory. Click Cancel to abort.
Well Bores
This section of the create well dialog allows you to add one (1) or more Well Bores to the defined top hole location.
+Add Bore - Press this button to start defining the new well bore downwards from the Well top-hole location.
+Add Bores from Files - This option will present a file selection dialog to load well bores from your computer.
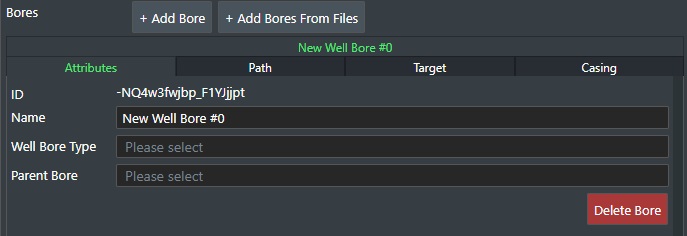
Once you have selected to add a new bore you will se a new panel in the dialog with four (4) tabs, namely Attributes, Path, Targets, and Casing.
Attributes - This tab displays the well bore attributes.
-
ID - This displays the unique system Identifier for the well bore. Only useful if you are using the REST API.
-
Name - Specify the name of the new well bore you want to create, or edit an existing name.
-
Well Bore Type - If metadata have been defined for Well Bore Types in Account Settings > Well Bore Types then they will appear for selection here.
-
Parent Bore - Will present a list of parent bores if any to select from. .
-
Delete Bore - Press this button to delete the well bore.
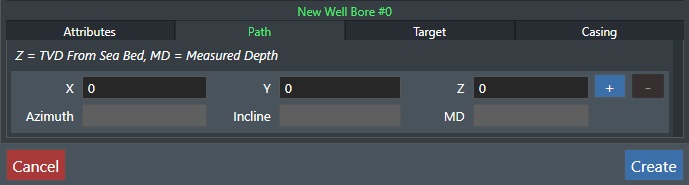
Path - This tab displays an existing well bore trajectory X,Y, and Z coordinates, or allows you to define a new trajectory by entering the coordinates:
-
X - Enter the X coordinate for the well bore trajectory.
-
Y - Enter the Y coordinate for the well bore trajectory.
-
Z - Enter the Z (Depth) coordinate for the well bore trajectory.
-
+ - Adds a new line for entering the next set of X,Y, and Z coordinates.
-
- - Deletes the corresponding line with coordinates.
Targets - This tab displays the well bore targets.
You will also see the read only values for Azimuth, Incline, and MD (Measured Depth).
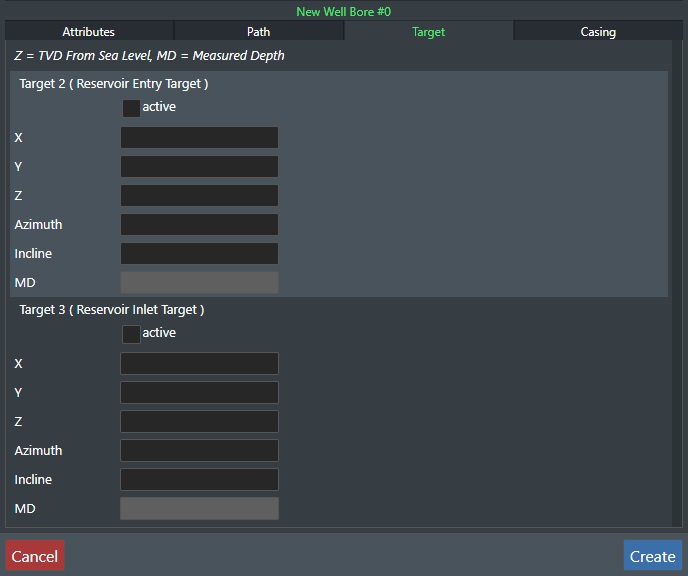
Here you enter the information for Target 2 (Reservoir Entry Point) and Target 3 (Reservoir Inlet Target):
-
Active - Check this box to make the target active.
-
X - Enter the X coordinate for the well bore trajectory.
-
Y - Enter the Y coordinate for the well bore trajectory.
-
Z - Enter the Z (Depth) coordinate for the well bore trajectory.
-
Azimuth - Enter the Azimuth value for the well bore trajectory.
-
Incline - Enter the Incline value for the well bore trajectory.
You will also see the read only value for MD (Measured Depth).
Target 3 have the exact same input parameters.
The click on Create button to update the well with the well bore information, or press the Cancel button to abort.
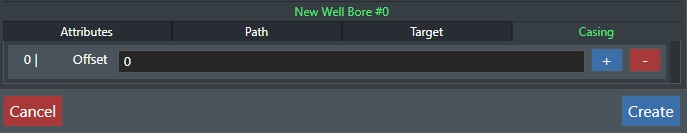
Casing - This tab displays the casing information.
-
+ - Adds a new line for entering the next casing offset.
-
- - Deletes the corresponding line.
-
Offset - Enter the casing shoe offset value here.
If you click the Create button now you will create a well with all the updated information. Click Cancel to abort.
Well Attributes
The Well Attribute/Settings in Project View section has three (3) tabs namely Common, Wells, and Logs.
Common
The Common tab is comprised of the general common attributes/settings for a Well layer.
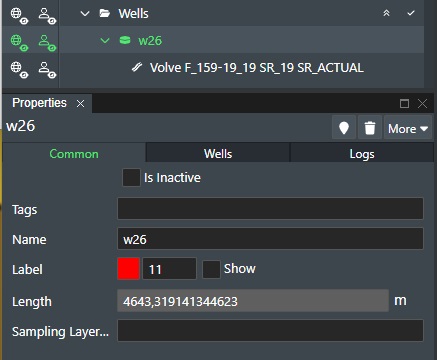
Is Inactive - Check this box if the asset e.g. the well is not used in the project. It will then be marked in red, and no longer be available for any sort of operation or function.
Tags - This allows you to assign user tags for group operations to the well object.
Name - Specify/change the name of the well here.
Label - Allows you to change the font color and font size for the well name. Use the Show check box to select if the text should be On or Off.
Length - Displays the length of the selected well trajectory in meters.
Sampling Layer - Select the layer to sample the entry point for the well on the bathymetry so the well is always on top of the seabed.
Wells
The Wells tab holds the well specific settings for a Well layer.
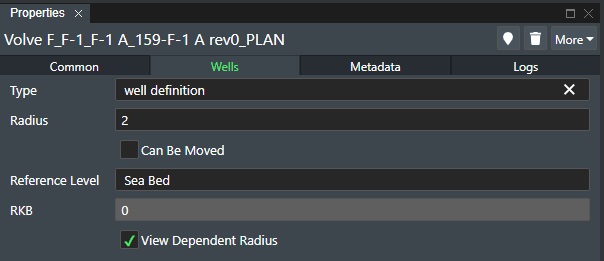
Type - If Metadata definitions have been defined in the account settings Well Type Setting a list of the defined well types will be shown here and allow you to select it. This will then add a corresponding Metadata tab for user selection.
Radius - Specifies the size of the radius for the well trajectory rendering. Increase this for better visibility in 2D and 3D Mode by entering a number or using the slider control.
Can be Moved - Check this box to be able to click and drag the top hole location around in 2D mode.
Reference Level - Select between seabed, sea, or rkb from the drop down list to define where the Top hole reference should be.
RKB - If you have selected "RKB" as the reference label you can define the value here.
View Dependent Radius - If this is checked the radius will follow the stage scale settings.
Well Bores
If you have selected a well bore then you have a Bores and a Visualisation tab as shown below.
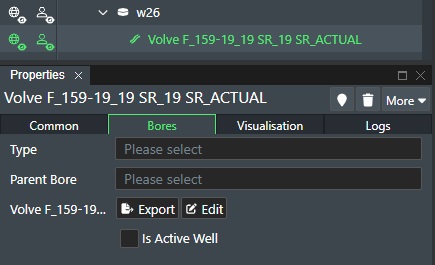
Bores
Type - If Metadata definitions have been defined in the account settings Well Bore Type Setting a list of the defined well bore types will be shown here and allow you to select it. This will then add a corresponding Metadata tab for user selection.
Parent Bore - Will display available parent bores that you can assign this bore to.
Export - Click this button to export the well bore to an ASCII text file in X,Y,Z format.
Edit - Click this button to display the Well Editor with this bore selected.
Is Active Well - Check this box to indicate that this is an active well bore.
Visualisation
This allows you to add visualization for well bores. The functionality is the same as for visualising connections. You can read more about it here Visualisation
Metadata
If a selection has been made from the Type list in the Wells or Bore tab then the Metadata that has been defined in the account settings will appear in an additional tab as shown here:
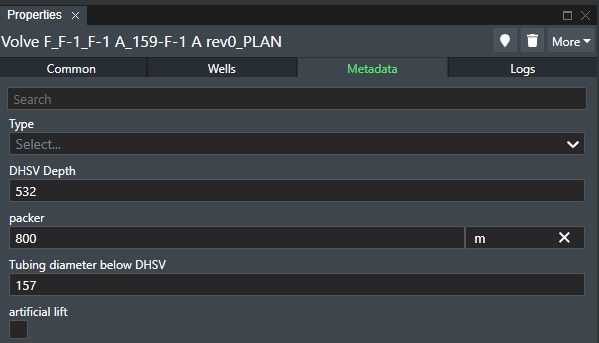
This will allow the user to make input and/or selections to the defined metadata attributes for the well/well bore, which then can be used for input for integrations to the system as one example.
Logs
The log section will show the creation of the well/well bore with a timestamp and the last 10 operations for the selected well:
This displays the following columns with information:
User - The email of the user that made the change.
Date - The date and time of the change.
Keys - The operation that was performed.
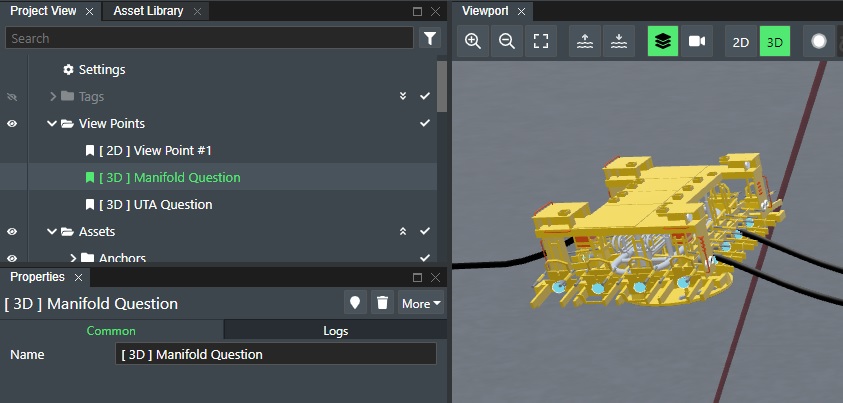
View Point
This allows you to create a View Point or bookmark of the current viewport location in either 2D or 3D mode. You can later select the created View Point from Project View to navigate back to that exact scene. To create a "View Point" select it from the Create Menu. The created View Point will then be displayed under the View Points section in Project View and prefaced with either [2D] or [3D] based on the view it was created in:
To go to a created View Point double click on the one you want under View Points in project view and the viewport will update accordingly.
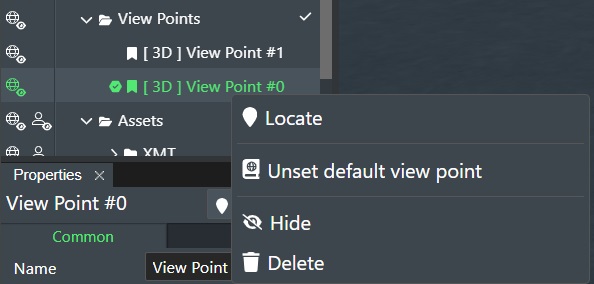
You can also use View Points to set a Default View, which if set will be the current view when opening a project. You do this by right clicking the created View Point in Project View to bring up the context menu as shown below:
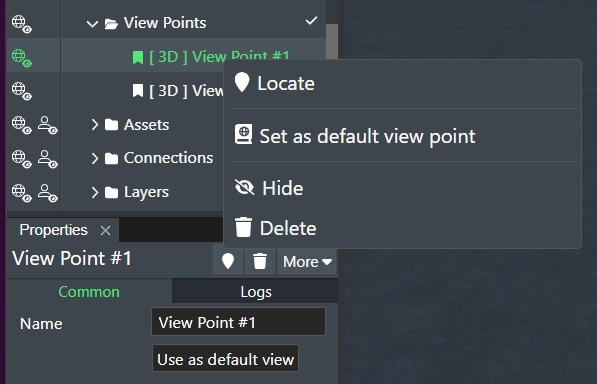
Note! You can also click on the Use as default view button in the property panel.
Once this is set you will see a checkmark next to it in the list of View Points in Project View:
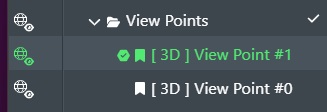
The next time you open the project the View Port will display the 2D or 3D view specified by the default View Point.
You can remove the default view point by right clicking the entry and selecting Unset default view point.
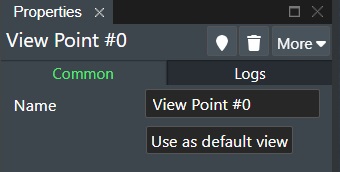
View Point attributes
Common tab
-
Name - Specify/change the name of the View Point here.
-
Use as default view - Click this to make this view point default.
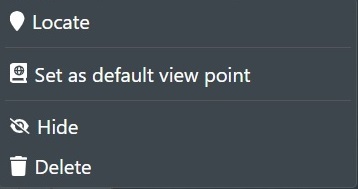
If you right click on a View Point, a menu of available options will be displayed as shown here:
-
Locate - This updates the current stage view to your selected View Point.
-
Set as default view point - This will make this the default view every time you open the project.
-
Unset default view point - Only available if a default view point has been set already.
-
Hide - This disables the view point. Click Show to enable it again.
-
Delete - Deletes the selected View Point.
These options are also available as icons in the Common Attribute Settings for the View Point Layer.
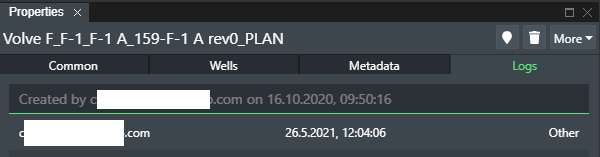
Logs tab
The log section will show the last 10 operations for the selected View Point:
This displays the following columns with information:
User - The email of the user that made the change.
Date - The date and time of the change.
Keys - The operation that was performed.